. 2007 Dec 19:8:112.
doi: 10.1186/1471-2199-8-112.

Checkpoint independence of most DNA replication origins in fission yeast

Affiliations

Checkpoint independence of most DNA replication origins in fission yeast

Katie L Mickle et al. BMC Mol Biol. .

Abstract

Background: In budding yeast, the replication checkpoint slows progress through S phase by inhibiting replication origin firing. In mammals, the replication checkpoint inhibits both origin firing and replication fork movement. To find out which strategy is employed in the fission yeast, Schizosaccharomyces pombe, we used microarrays to investigate the use of origins by wild-type and checkpoint-mutant strains in the presence of hydroxyurea (HU), which limits the pool of deoxyribonucleoside triphosphates (dNTPs) and activates the replication checkpoint. The checkpoint-mutant cells carried deletions either of rad3 (which encodes the fission yeast homologue of ATR) or cds1 (which encodes the fission yeast homologue of Chk2).

Results: Our microarray results proved to be largely consistent with those independently obtained and recently published by three other laboratories. However, we were able to reconcile differences between the previous studies regarding the extent to which fission yeast replication origins are affected by the replication checkpoint. We found (consistent with the three previous studies after appropriate interpretation) that, in surprising contrast to budding yeast, most fission yeast origins, including both early- and late-firing origins, are not significantly affected by checkpoint mutations during replication in the presence of HU. A few origins (approximately 3%) behaved like those in budding yeast: they replicated earlier in the checkpoint mutants than in wild type. These were located primarily in the heterochromatic subtelomeric regions of chromosomes 1 and 2. Indeed, the subtelomeric regions defined by the strongest checkpoint restraint correspond precisely to previously mapped subtelomeric heterochromatin. This observation implies that subtelomeric heterochromatin in fission yeast differs from heterochromatin at centromeres, in the mating type region, and in ribosomal DNA, since these regions replicated at least as efficiently in wild-type cells as in checkpoint-mutant cells.

Conclusion: The fact that approximately 97% of fission yeast replication origins - both early and late - are not significantly affected by replication checkpoint mutations in HU-treated cells suggests that (i) most late-firing origins are restrained from firing in HU-treated cells by at least one checkpoint-independent mechanism, and (ii) checkpoint-dependent slowing of S phase in fission yeast when DNA is damaged may be accomplished primarily by the slowing of replication forks.


Figures

Figure 1
Figure 1
Synchronization of fission yeast cells by release from G2 arrest into HU. Three isogenic fission yeast strains – JLP1164 (cdc25-22; green), JLP1257 (cdc25-22 cds1Δ; blue), and JLP1260 (cdc25-22 rad3Δ; red) were arrested in G2 phase, then released (at time 0) into the cell cycle in the presence of 15 mM HU. (A) Measurements of septation indices at the indicated times after release. (B) Flow cytometric measurements of DNA content, using a fluorescent DNA-specific stain (Sytox Green), at the indicated times after release. See the text for interpretation.
Figure 2
Figure 2
Microarray measurements of copy number increases on a segment of DNA in the right arm of chromosome 1. For clarity, the symbols used in this graph are explained in the keys (boxes) above and below the graph. They are also explained here. The information in this legend applies not only to Fig. 2 but also to Figs. 7 and 8, and to Additional Files 1, 2, 3 and 11, 12, 13, 14. The upper set of vertical lines shows relative copy numbers of the indicated probes 2 hrs after release from the G2 block, while the lower set of vertical lines shows results for 4-hr cells. Green lines: wild-type cells (JLP1164), plotted at their correct positions. Blue lines: cds1Δ (JLP1257), plotted to the right of their correct positions. Red lines: rad3Δ (JLP1260), plotted further to the right of their correct positions. The horizontal offsets of the blue and red lines were introduced to permit simultaneous visualization of the results for all three strains (wild-type, cds1Δ and rad3Δ). The heights of most lines represent the averages of 3–5 independent hybridizations to the same probe. Due to probe-specific experimental noise, for a few probes the number of successful hybridizations was only one or two. The average deviations of the individual hybridizations from the average value are indicated by appropriately colored small rectangles above and below the end point of each vertical line. For probes with only a single successful hybridization, no rectangle is shown. Because the probes mostly correspond to predicted gene locations, they are not uniformly spaced along the DNA. The names of the probes are indicated in black vertical type. In most cases, the names of the probes are the same as the names of the genes in which they are located. These genes are shown as thick yellow arrows above the corresponding probe names. The red, continuous graph indicates AT content in a sliding 500-bp window along the genome. Lower down, the names and locations of AT islands [20] are shown in magenta. The AT islands are numbered sequentially from left to right in each chromosome (except for a few cases where their chromosomal locations have been altered due to improved sequencing results since the original assignment of AT island names [20]). A "+" after the AT island name (not present in Fig. 2, but present at some locations in Figs. 7 and 9 and Additional File 13) indicates that a restriction fragment containing the AT island has been tested by 2D gel electrophoresis and found to have origin activity. If the origin associated with an AT island was previously studied and assigned a name, we show that name immediately after the "+". Conversely, a "-" after the AT island name (not present in Fig. 2, but present at a subset of locations in Additional Files 1, 2, 3 and 11) indicates that a restriction fragment containing the AT island failed to show origin activity by 2D gel electrophoresis. Below the AT island names are light blue circles, which indicate each of the 401 locations identified as "stronger origins" by Heichinger et al. [14]. Further down are purple and orange circles, which show the positions identified as origins by Feng et al. [34] using the ssDNA method, in wild-type or cds1Δ cells, respectively. At the bottom of the graph are red and dark blue symbols, which are circles in the case of Fig. 2 but could also be squares (as in Fig. 8A, C). The red circles/squares indicate the positions of pre-RCs which were found to be active by BrdU incorporation and were classified as strong/early origins [15] The blue circles/squares indicate pre-RCs which did not score as active by BrdU incorporation and were classified as late/weak origins [15]. Circles indicate pre-RCs whose signal strength was the same in wild-type and cds1Δ cells, while squares indicate pre-RCs whose signal strength was higher in cds1Δ cells than in wild-type cells. The latter were considered to indicate checkpoint-restrained origins [15].
Figure 3
Figure 3
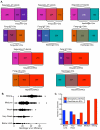
Correlations between our results and published studies of fission yeast replication origins. (A) Rectangular Venn diagrams showing the extents to which previously published locations of potential origins correlate with each other. The number in each box is the number of potential origins in the category represented by that box. The area of each box is proportional to the number in the box. The colors in the left- and right-hand boxes are coded in the following way: magenta represents AT islands, purple represents the origins identified by Feng et al. [34] in wild-type cells, orange represents the origins identified by Feng et al. in cds1Δ cells, light blue indicates origins identified by Heichinger et al. [14], and red indicates pre-RCs identified by Hayashi et al. [15]. The colors in the middle boxes are intended to be blends of the colors in the left- and right-hand boxes, and they are intended to indicate that the middle box in each diagram represents the set of potential origins that was identified in common by the two studies represented by the left- and right-hand boxes. The left- and right-hand boxes, in contrast, show the numbers of potential origins in the indicated studies that did not co-localize with each other. (B) Correlation between the origin efficiencies determined by Heichinger et al. [14] and us. As described in the text, the signal strength that we determined at the position of each of the origins identified by Heichinger et al. was assigned to one of five categories (ranging from below limit to strong; vertical axis) and plotted as a small black circle against the mitotic efficiency of that origin measured by Heichinger et al. (horizontal axis). In cases where more than one origin had identical efficiencies as scored by us and by Heichinger et al., the size of the circle was proportionally enlarged. (C) Correlation between the strong/early or weak/late classifications of pre-RCs by Hayashi et al. [15] and our classifications of origin strength. The numbers of weak/late pre-RCs from the study of Hayashi et al. that fell into each of our classifications are plotted as blue bars against the classifications. The strong/early pre-RCs are similarly plotted as red bars.
Figure 4
Figure 4
AT islands correlate with strong potential origin activity. The signals from the probes flanking the 387 AT island positions were evaluated and assigned to one of the five categories (below limit to strong; horizontal axis), and the percentage of AT islands in each of the five categories was determined (magenta bars; vertical axis). Similarly, the percentages of signals in each category from the 4636 pairs of adjacent probes that did not flank AT islands were also plotted (blue bars). To obtain the randomized results (cream-colored bars), the six datasets (wild-type, cds1Δ, and rad3Δ at 2 and 4 hours) were randomized for position within each dataset, and the scores for all positions were re-calculated. This was repeated ~1000 times, and the resulting average percentages are shown.
Figure 5
Figure 5
Distributions of origin efficiencies on the three chromosomes and in the genome. These pie charts show the distributions of predicted origins with the indicated efficiencies on the three fission yeast chromosomes and also in the whole genome. The whole genome scores are the sums of the scores for the three chromosomes.
Figure 6
Figure 6
Locations and efficiencies of putative origins on the three chromosomes. The chromosomes are shown as consecutive horizontal lines, 1 Mbp per line. The position of the centromere on each chromosome is indicated by a light yellow rectangle. The positions of origins classified as strong, medium, weak or very weak are identified by vertical lines. The lines range in color from red (strong) to brown (very weak) and from long (strong) to short (very weak). The positions of potential origins below the detection limit are indicated by the text character, "0", and ambiguous origins (where our probes were too widely spaced to permit confident evaluation) are shown by the character, "?". Small circles above each chromosome line indicate the positions of origins identified by Heichinger et al. ([14]; top row of circles; light blue), AT islands (next row of circles; magenta), origins identified by Feng et al. [34] in cds1Δ cells (next row; orange) or in wild-type cells (next row; purple), and pre-RCs identified by Hayashi et al. ([15]; bottom row; dark blue or red circles or squares). For the pre-RCs, the colors blue and red distinguish the pre-RCs that are late/weak or early/strong, respectively. The circles represent pre-RCs that are not affected by deletion of cds1, while the squares indicate pre-RCs that replicate to a greater extent in cds1Δ cells than in wild-type cells [15]. The positions of origins where the signals (our measurements; Additional Files 4, 5, 6) for both checkpoint-mutant strains were significantly greater than the signal for wild-type cells are indicated by the text character, "C", and the positions of origins with the opposite characteristic (wild-type signal significantly greater than the signals from both checkpoint-mutant strains) are shown by the text character, "W". A pale green background indicates a large region with a high frequency of stronger origins. A pale yellow background indicates a large region with a high frequency of weaker origins. (A) chromosome 1; (B) chromosome 2; (C) chromosome 3.
Figure 7
Figure 7
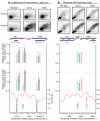
Origins that do not replicate in HU may normally replicate in late S phase. (A) 2D gel analysis revealed that a ScaI restriction fragment containing AT1045 near its center replicated only slightly in HU, producing a faint Y arc (white arrow; 0 minutes), but replicated more extensively after HU was removed (15–60 minutes), with a weak bubble arc indicative of origin activity evident at 30 and 45 minutes (dark arrows). The diagram underneath the 2D gel pictures illustrates a 6-kb segment of genomic DNA containing the studied ScaI restriction fragment. The scale indicates the nucleotide position along chromosome 1. Genes, along with their names and directions of transcription, are indicated below the scale. The magenta stretch in the middle of the ScaI restriction fragment indicates the central third of that fragment, within which an origin – if present – is likely to be capable of generating detectable bubble arcs [58]. (B) Microarray results for the two probes flanking AT1045. The wild-type (green) signal for the right-hand probe exceeded the threshold of 1.1 at 4 hours, leading to the classification of "very weak". (C) A restriction fragment containing AT2067 was previously tested and shown to have origin activity [20]. However, our microarray results (all signals below 1.0) suggest that AT2067 does not replicate in HU. AT2067 may replicate in late S phase (only after HU removal), as in the case of AT1045. (D) Microarray measurements for the two probes flanking Ori6. DD Dubey, VK Srivastava, AS Pratihar and MP Yadava (submitted for publication; personal communication) used 2D gel electrophoresis to carefully study a 75-kb stretch of chromosome 2. They found six origins (Ori1-Ori6) capable of generating bubble arcs (summarized in Additional File 10). In HU synchronization experiments, they found that Ori6 replicated only after release from HU. This is consistent with our microarray measurements, which show little or no replication of this region in the continued presence of HU. In panels (B)-(D) the small symbols indicating the origins detected experimentally by other laboratories [34] [14] [15] are not shown.
Figure 8
Figure 8
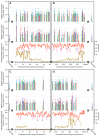
Replication of subtelomeric heterochromatin in the presence of HU is restrained by the Rad3- and Cds1-dependent replication checkpoint. Here the microarray results at the ends of the sequenced portions of chromosomes 1 and 2 are shown in comparison with the relative enrichment for methylated histone H3 lysine 9 (H3K9me; gold lines at bottoms of graphs) determined by Cam et al. [42]. The "telomere" probe is from the same region of telomere-associated sequences employed by Kim and Huberman [18] for their analysis of telomere replication timing in wild-type and checkpoint-mutant strains. (A) Left end of chromosome 1. (B) Right end of chromosome 1. (C) Left end of chromosome 2. (D) Right end of chromosome 2. The colored symbols representing origins discovered in other laboratories are sparse (A)-(C) or missing (D) in these subtelomeric regions, because the probes used in the other laboratories frequently did not extend to the ends of the 2006 versions of the sequences for S. pombe chromosomes 1 and 2.
Figure 9
Figure 9
Checkpoint-mutation-dependent late replication of subtelomeric sequences but not ribosomal DNA in HU-treated fission yeast cells. The same strains (JLP1164, JLP1257 and JLP1260) were employed as for the microarray experiments. All three strains contain the cdc25-22 mutation, which allowed them to be blocked in G2 by incubation at 36.5°C. The cells were released from the G2 block and further incubated at 25°C for two or four hours in the presence of 15 mM HU. DNA was isolated at the indicated times, digested with the indicated restriction enzymes, and processed for 2D gel electrophoresis. The diagrams under the 2D gel panels show 6-kb stretches containing the studied restriction fragments (as in Fig. 7A). The horizontal axes of the graphs were adjusted to correspond in scale to the restriction fragment diagrams. In this figure there are no colored symbols representing the locations of origins discovered in other laboratories [34] [14] [15], because none of the other laboratories employed microarray probes in these regions. (A) The probe detected a restriction fragment centered on nucleotide position ~4.524 Mb, in the heterochromatic region near the right end of chromosome 2 (Fig. 8B, Additional File 12). Strong Y arcs, and a smear of replication intermediates with altered structures, are evident only in the checkpoint-mutant strains at the 4-hour time point. (B) The probe detected a restriction fragment centered on ars3001 in the rDNA repeats. Bubble arcs are evident only in the samples from wild-type cells, suggesting that the replication checkpoint is required to prevent loss of bubbles under these experimental conditions.

Similar articles

Cited by

References

    1. Bell SP, Dutta A. DNA replication in eukaryotic cells. Annu Rev Biochem. 2002;71:333–374. doi: 10.1146/annurev.biochem.71.110601.135425. - DOI - PubMed
    1. Chuang RY, Kelly TJ. The fission yeast homologue of Orc4p binds to replication origin DNA via multiple AT-hooks. Proc Natl Acad Sci USA. 1999;96:2656–2661. doi: 10.1073/pnas.96.6.2656. - DOI - PMC - PubMed
    1. Lee JK, Moon KY, Jiang Y, Hurwitz J. The Schizosaccharomyces pombe origin recognition complex interacts with multiple AT-rich regions of the replication origin DNA by means of the AT-hook domains of the spOrc4 protein. Proc Natl Acad Sci USA. 2001;98:13589–13594. doi: 10.1073/pnas.251530398. - DOI - PMC - PubMed
    1. Kong D, DePamphilis ML. Site-specific DNA binding of the Schizosaccharomyces pombe origin recognition complex is determined by the Orc4 subunit. Mol Cell Biol. 2001;21:8095–8103. doi: 10.1128/MCB.21.23.8095-8103.2001. - DOI - PMC - PubMed
    1. Zhu J, Carlson DL, Dubey DD, Sharma K, Huberman JA. Comparison of the two major ARS elements of the ura4 replication origin region with other ARS elements in the fission yeast, Schizosaccharomyces pombe. Chromosoma. 1994;103:414–422. doi: 10.1007/BF00362286. - DOI - PubMed

Publication types

MeSH terms