Comparative Study
. 2007 Dec 20:8:113.
doi: 10.1186/1471-2199-8-113.

Relative quantification of mRNA: comparison of methods currently used for real-time PCR data analysis

Affiliations
Comparative Study

Relative quantification of mRNA: comparison of methods currently used for real-time PCR data analysis

Stefan Cikos et al. BMC Mol Biol. .

Abstract

Background: Fluorescent data obtained from real-time PCR must be processed by some method of data analysis to obtain the relative quantity of target mRNA. The method chosen for data analysis can strongly influence results of the quantification.

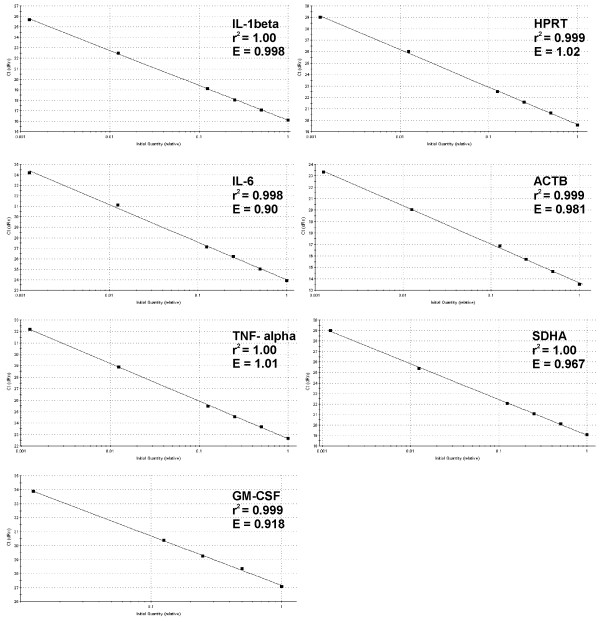
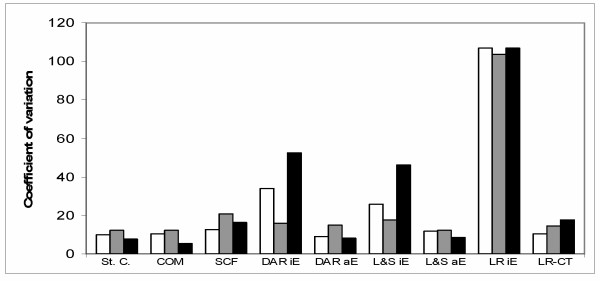
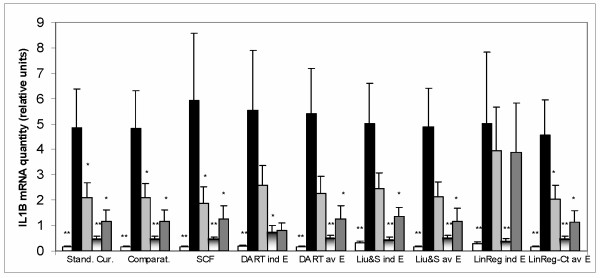
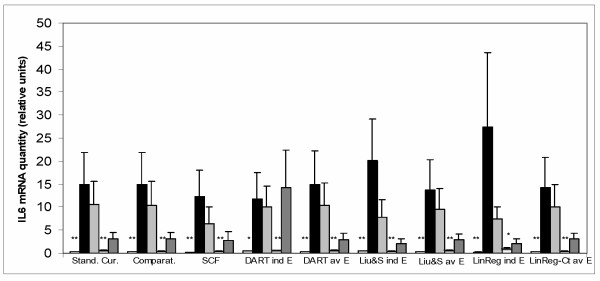
Results: To compare the performance of six techniques which are currently used for analysing fluorescent data in real-time PCR relative quantification, we quantified four cytokine transcripts (IL-1beta, IL-6 TNF-alpha, and GM-CSF) in an in vivo model of colonic inflammation. Accuracy of the methods was tested by quantification on samples with known relative amounts of target mRNAs. Reproducibility of the methods was estimated by the determination of the intra-assay and inter-assay variability. Cytokine expression normalized to the expression of three reference genes (ACTB, HPRT, SDHA) was then determined using the six methods for data analysis. The best results were obtained with the relative standard curve method, comparative Ct method and with DART-PCR, LinRegPCR and Liu & Saint exponential methods when average amplification efficiency was used. The use of individual amplification efficiencies in DART-PCR, LinRegPCR and Liu & Saint exponential methods significantly impaired the results. The sigmoid curve-fitting (SCF) method produced medium performance; the results indicate that the use of appropriate type of fluorescence data and in some instances manual selection of the number of amplification cycles included in the analysis is necessary when the SCF method is applied. We also compared amplification efficiencies (E) and found that although the E values determined by different methods of analysis were not identical, all the methods were capable to identify two genes whose E values significantly differed from other genes.

Conclusion: Our results show that all the tested methods can provide quantitative values reflecting the amounts of measured mRNA in samples, but they differ in their accuracy and reproducibility. Selection of the appropriate method can also depend on the design of a particular experiment. The advantages and disadvantages of the methods in different applications are discussed.


Figures

Figure 1
Figure 1
Relative standard curves. The standard curves were generated by the Mx3000P software by plotting cycles at threshold fluorescence (Ct) against the logarithmic values of standard RNA amounts. Quantities of standard RNA were expressed as dilution factors of the RNA preparation (1, 0.5, 0.25, 0.125, 0.0125, 0.00125). Correlation coefficients (square values – r2) and amplification efficiencies (E) are shown. SYBRGreen I fluorescences were corrected with passive reference dye (ROX) fluorescences („dRn“).
Figure 2
Figure 2
Coefficients of variation for normalized quantity of IL-1β in serial dilutions of the RT-PCR template. Quantities of IL-1β, HPRT, SDHA and ACTB mRNAs (the R0 values) were determined in each dilution of the RT-PCR template (six dilutions of total RNA) using all the tested methods of real-time PCR data analysis. The amount of IL-1β mRNA in each dilution was then divided by the relative amount of HPRT, ACTB, or by the normalization factor (NF, geometric mean of HPRT, SDHA and ACTB amounts) of the dilution. Arithmetical mean, standard deviation and coefficient of variation of the normalized IL-1β quantity for each type of normalization (HPRT, ACTB, NF) and each method of real-time PCR data analysis was then calculated. Coefficients of variation (CV) are shown: the first columns are CV values after normalization with the normalization factor, the second columns are CV values after normalization with ACTB, and the third columns are CV values after normalization with HPRT. Methods for real-time PCR data analysis: St. C., relative standard curve; COM, comparative Ct; SCF, sigmoid curve-fitting; DAR iE, DART-PCR with individual E values; DAR aE, DART-PCR with average E values; L&S iE, Liu & Saint-exp with individual E values, L&S aE, Liu & Saint-exp with average E values; LR iE, LinRegPCR (using individual E values); LR-Ct, LinRegPCR combined with Ct (using average E values)
Figure 3
Figure 3
IL-1β mRNA expression. Quantities of IL-1β, HPRT, SDHA and ACTB mRNAs (the R0 values) were determined in each sample using all the tested methods of real-time PCR data analysis. The amount of IL-1β mRNA in each sample was then divided by the normalization factor (geometric mean of HPRT, SDHA and ACTB amounts) of the sample. Values are arithmetical means + SEM, n = 5–8. Statistical significance of the differences between the group of untreated colitic animals (Un) and other groups of animals was assessed with the Mann-Whitney test: * P ≤ 0.05, ** P ≤ 0.01. Methods for real-time PCR data analysis: Stand curv, relative standard curve; Comparat, comparative Ct; SCF, sigmoid curve-fitting; DART ind E, DART-PCR with individual E values; DART av E, DART-PCR with average E values; Liu&S ind E, Liu & Saint-exp with individual E values, Liu&S av E, Liu & Saint-exp with average E values; LinReg ind E, LinRegPCR (using individual E values); LinReg-Ct av E, LinRegPCR combined with Ct (using average E values) Designation of the animal groups: the first columns, control sham animals (Sh); the second columns, untreated colitic animals (Un); the third columns, colitic animals with the treatment A; the fourth columns, colitic animals with the treatment B; the fifth columns, colitic animals with the treatment C
Figure 4
Figure 4
IL-6 mRNA expression. Quantities of IL-6, HPRT, SDHA and ACTB mRNAs (the R0 values) were determined in each sample using all the tested methods of real-time PCR data analysis. The amount of IL-6 mRNA in each sample was then divided by the normalization factor (geometric mean of HPRT, SDHA and ACTB amounts) of the sample. Values are arithmetical means + SEM, n = 5–8. Statistical significance of the differences between the group of untreated colitic animals (Un) and other groups of animals was assessed with the Mann-Whitney test: * P ≤ 0.05, ** P ≤ 0.01. Designation of the methods and animal groups is the same as in Figure 3.

Similar articles

Cited by

References

    1. Bustin SA. Quantification of mRNA using real-time reverse transcription PCR (RT-PCR): trends and problems. J Mol Endocrinol. 2002;29:23–39. doi: 10.1677/jme.0.0290023. - DOI - PubMed
    1. Huggett J, Dheda K, Bustin SA, Zumla A. Real-time RT-PCR normalisation; strategies and considerations. Genes Immun. 2005;6:279–284. doi: 10.1038/sj.gene.6364190. - DOI - PubMed
    1. Skern R, Frost P, Nilsen F. Relative transcript quantification by quantitative PCR: Roughly right or precisely wrong? BMC Mol Biol. 2005;6:10. doi: 10.1186/1471-2199-6-10. DOI 10.1186/1471-2199-6-10. - DOI - PMC - PubMed
    1. Pfaffl MW. Quantification strategies in real-time PCR. In: Bustin SA, editor. A-Z of Quantitative PCR. International University Line (IUL), La Jolla; 2004. pp. 86–120.
    1. Wong ML, Medrano JF. Real-time PCR for mRNA quantitation. BioTechniques. 2005;39:75–85. - PubMed

Publication types

MeSH terms

LinkOut - more resources