. 2007 Dec;27(6):912-26.
doi: 10.1016/j.immuni.2007.11.013.

Opposing functions of the T cell receptor kinase ZAP-70 in immunity and tolerance differentially titrate in response to nucleotide substitutions

Affiliations

Opposing functions of the T cell receptor kinase ZAP-70 in immunity and tolerance differentially titrate in response to nucleotide substitutions

Owen M Siggs et al. Immunity. 2007 Dec.

Abstract

Null mutations that cripple T cell receptor (TCR) signaling explain rare primary immunodeficiencies, but it is not understood why more common polymorphisms that lead to subtle TCR signaling defects are paradoxically associated with autoimmunity. Here we analyzed how a series of Zap70 variants with step-wise decreases in TCR signaling impacted upon opposing TCR functions of immunity and tolerance. One Zap70 variant, murdock, moderately decreased TCR signaling and thymic selection without compromising immunological tolerance, whereas a more severe Zap70 defect, mrtless, abolished thymic-positive selection and led to immunodeficiency. Signaling capacities between these two thresholds disproportionately compromised negative selection and Foxp3(+) regulatory T cell formation, creating a cellular imbalance between immunogenic and tolerogenic functions that resulted in the excessive production of autoantibodies and immunoglobulin E (IgE). The pleiotropic functions of ZAP-70 and their differential response to graded variation provide a paradigm for understanding the complex outcomes of human genetic variation.


Conflict of interest statement

Competing Interests Statement

The authors declare that they have no competing financial interests.

Figures
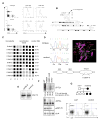
Figure 1
Figure 1. Fewer naïve T cells in mice with a ZAP-70 I367F catalytic site substitution, Zap70murdock
(A) Representative flow cytometry profiles of CD4 and CD8 expression upon peripheral blood lymphocytes, with representative histograms of CD44 expression on CD4+ and CD8+ cells from unaffected and mrd/mrd mice. (B) Initial generations of the murdock pedigree, including mapping intercross, showing affected mice (filled), unaffected animals (unfilled) and untyped (crossed) mice. (C) Meiotic mapping of the murdock mutation on chromosome 1. Haplotypes of affected mrd/mrd F2IC mice shown in columns: black squares indicate C57BL/6 homozygosity, grey squares indicate C57BL/6-NODk heterozygosity. NM, markers not positioned on the current mouse genome assembly. (D) An A to T transversion at murdock Zap70 cDNA nucleotide 1207 changes codon 367 (human codon 368) from isoleucine to phenylalanine within the ZAP-70 kinase domain. The location of the substituted residue is shown within the human ZAP-70 active kinase domain structure (PDB: 1U59, complexed with staurosporine), as well as the mrtless substitution and key elements of the active site. (E) Anti-ZAP-70 Western blot in C57BL/6 and mrd/mrd thymocytes. (F) ZAP-70 kinase assay in 293T cells cotransfected with NTAL, LCK and wild-type (WT) or mutant human ZAP70 constructs (K369A, kinase-inactive; I368F, murdock mutation; vector, no ZAP70 transfected). After 20 hrs cells were lysed and whole cell lysates immunoblotted with antibodies indicated on right. Net intensity of P-Tyr (×100), as normalized to NTAL in the corresponding sample, is indicated below respective lanes. (G) Pedigree schematic and low number of T cells in compound heterozygous offspring from parents bearing Zap70 murdock and mrtless missense mutations. Filled symbols denote animals with low T cell numbers.
Figure 2
Figure 2. Autoantibodies, hypergammaglobulinemia and hyper-IgE in Zap70mrd/mrt, but not Zap70mrd/mrd or Zap70mrt/mrt mice
(A) Incidence and representative examples of IgG anti-nuclear or anti-cytoplasmic autoantibodies in 8–15 week old mice of the indicated Zap70 genotypes. (B) Concentration of serum IgE and IgG1 antibodies in unimmunized mice of the indicated genotypes as measured by ELISA. (C) Relative ELISA titres of specific antibody to T-dependent (B. pertussis, CGG, ABA) and T-independent (NP2) immunogens 14 days and 6 days after primary and secondary immunization, respectively. Asterisk indicates P <0.05.
Figure 3
Figure 3. Graded and threshold effects of different Zap70 alleles upon peripheral T cell subsets
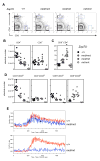
Representative percentage of lymphocytes (A), absolute number (B), and ratio (C) of CD4 and CD8 T cells in spleens of mice with the indicated Zap70 genotypes. (D) Absolute numbers of CD4+ and CD8+ lymphocytes within naïve (CD44lo) or activated/memory (CD44hi) compartments. Asterisk indicates P <0.05. (E) Anti-CD3-induced calcium flux in CD4 T cells from wild-type and mrd/mrd (upper panel) or mrd/mrt mice (lower panel).
Figure 4
Figure 4. Four allelic graded states of TCR signaling in thymocytes
Representative percentage of lymphocytes (A), and absolute number (B), of CD4CD8, CD4+CD8+, CD4+CD8 and CD4CD8+ thymocytes in B10.Br mice of the indicated Zap70 genotypes. (C) Normalised mean fluorescent intensities (MFI) of CD5, CD69, TCRβ and CD3ε expression upon CD4+CD8+ thymocytes, where the mean value in wild-type cells represents 100 units. Asterisk indicates P <0.05. Representative histograms are shown in Supplementary Figure 1.
Figure 5
Figure 5. Threshold effects of decreased ZAP-70 activity on CD4 cell negative selection
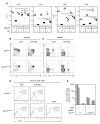
(A) Percentage of CD8+ or CD4+ T cells expressing Vβ11+ or Vβ5+ in peripheral blood lymphocytes of nontransgenic mice with the indicated Zap70 genotypes, and either H2b (open symbols) or H2k (filled) haplotypes. Asterisk indicates P <0.05. (B–D) Representative flow cytometry profiles and (B) percentages of thymocyte CD4 and CD8 subsets in TCR transgenic or TCR insHEL double-transgenic mice with wild type Zap70 or homozygous Zap70mrd/mrd. (C) Spleen cells from the same mice as (B), stained for CD4 and the 3A9 TCR clonotype, 1G12. (D) 1G12 clonotype staining on gated CD4+CD8 thymocytes from (B) and from a nontransgenic control. Numbers show percentage of CD4+CD8 cells, with bracketed numbers indicating percentage of all thymocytes, that are 1G12+ or 1G12hi. (E) Absolute number of CD4+CD8 1G12hi cells in the thymus of two animals of each genotype.
Figure 6
Figure 6. Threshold effects of decreased ZAP-70 activity on Foxp3+ regulatory T cells
(A) Representative flow cytometry profiles of CD4 and Foxp3 expression and percentage of CD4+Foxp3+ cells in thymocytes or splenocytes from mice of the indicated Zap70 genotypes. (B) Absolute numbers and percentages of CD4+CD8 thymocytes or splenocytes expressing Foxp3. Asterisk indicates P <0.05. (C) Representative histogram overlay of CD25 expression upon CD4+Foxp3+ splenocytes from B10.Br (shaded), mrd/mrd (dotted), or mrd/mrt (solid) mice.
Figure 7
Figure 7. Failure to suppress IgE secretion in mrd/mrt chimeric mice with +/+ CD4+Foxp3+ cells
(A) Irradiated RAG1-deficient mice were reconstituted with mixtures of fetal liver cells from CD45.2+ mrd/mrt and CD45.1+ wild-type or Foxp3-deficient donors, and serum IgE measured 6–7 weeks post-reconstitution. Columns show median values; ns, no significant difference; asterisk, significant P <0.05, between indicated experimental group and 100% mrd/mrt chimeras by Kruskal-Wallis test with Dunn’s post-test. (B) Chimeric mice were analysed at the same time for the percentage of CD4 T cells derived from Zap70-wildtype CD45.1 donor stem cells. (C) Flow cytometry profiles of CD45.1 and Foxp3 expression in CD4+ splenocytes from representative chimeric recipients. Serum IgE concentrations for each mouse are given alongside.

References

    1. Aguado E, Richelme S, Nunez-Cruz S, Miazek A, Mura AM, Richelme M, Guo XJ, Sainty D, He HT, Malissen B, Malissen M. Induction of T helper type 2 immunity by a point mutation in the LAT adaptor. Science. 2002;296:2036–2040. - PubMed
    1. Akkaraju S, Ho WY, Leong D, Canaan K, Davis MM, Goodnow CC. A range of CD4 T cell tolerance: partial inactivation to organ-specific antigen allows nondestructive thyroiditis or insulitis. Immunity. 1997;7:255–271. - PubMed
    1. Arkwright PD, Abinun M, Cant AJ. Autoimmunity in human primary immunodeficiency diseases. Blood. 2002;99:2694–2702. - PubMed
    1. Arpaia E, Shahar M, Dadi H, Cohen A, Roifman CM. Defective T cell receptor signaling and CD8+ thymic selection in humans lacking zap-70 kinase. Cell. 1994;76:947–958. - PubMed
    1. Azzam HS, Grinberg A, Lui K, Shen H, Shores EW, Love PE. CD5 expression is developmentally regulated by T cell receptor (TCR) signals and TCR avidity. J Exp Med. 1998;188:2301–2311. - PMC - PubMed

Publication types