. 2007 Dec;27(6):952-64.
doi: 10.1016/j.immuni.2007.11.014.

Interleukin-10 expression in macrophages during phagocytosis of apoptotic cells is mediated by homeodomain proteins Pbx1 and Prep-1

Affiliations

Interleukin-10 expression in macrophages during phagocytosis of apoptotic cells is mediated by homeodomain proteins Pbx1 and Prep-1

Elaine Y Chung et al. Immunity. 2007 Dec.

Abstract

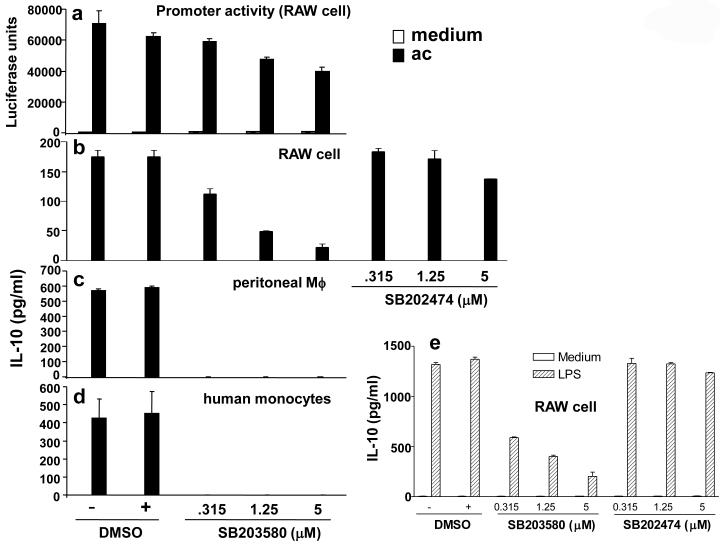
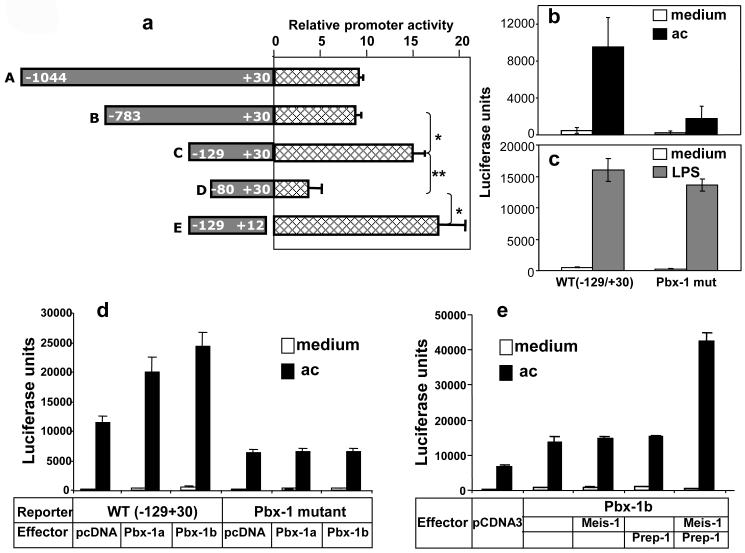
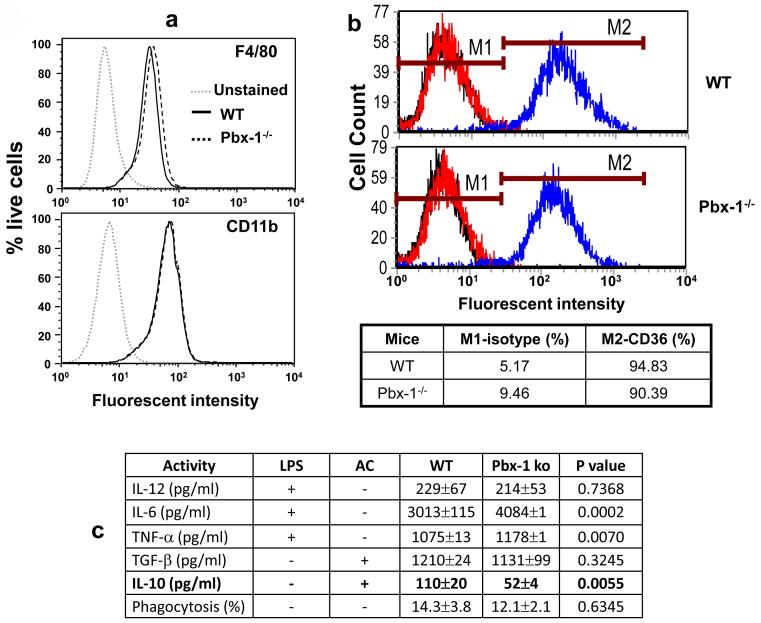
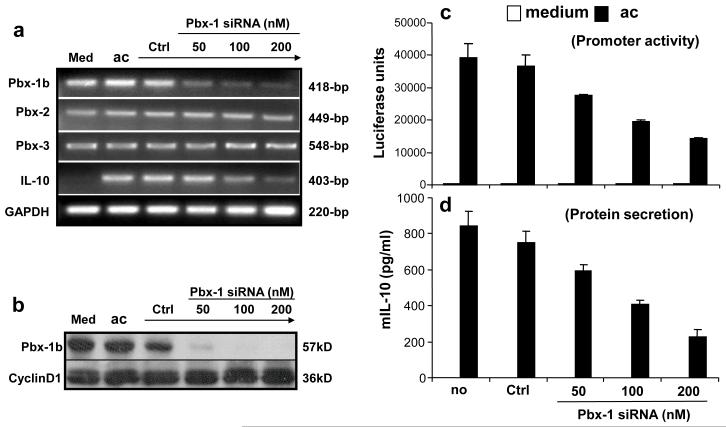
Production of interleukin (IL)-10, a major immunoregulatory cytokine, by phagocytes during clearance of apoptotic cells is critical to ensuring cellular homeostasis and suppression of autoimmunity. Little is known about the regulatory mechanisms in this fundamental process. We report that IL-10 production stimulated by apoptotic cells was regulated at the point of transcription in a manner dependent on p38 mitogen-activated protein kinase, partially on the scavenger receptor CD36, and required cell-cell contact but not phagocytosis. By using a reporter assay, we mapped the apoptotic-cell-response element (ACRE) in the human IL10 promoter and provide biochemical and physiological evidence that ACRE mediates the transcriptional activation of IL10 by pre-B cell leukemia transcription factor-1b and another Hox cofactor Pbx-regulating protein 1 in response to apoptotic cells. This study establishes a role of two developmentally critical factors (Pbx1 and Prep-1) in the regulation of homeostasis in the immune system.


Figures

Figure 1
Figure 1. Macrophages produce IL-10 in response to apoptotic cells
(a) Apoptosis of Jurkat cells was induced 0, 3, 6, and 12 hrs. The percentage of early and late-apoptotic cells was quantified by flow cytometry analysis using Annexin V and propidium iodide (PI) staining. The numbers indicate percentages of the subpopulations. (b-d) 0.5 × 10⁵ thioglycollate-elicited peritoneal macrophages (c and e) or HMDM (b), or RAW264.7 cells (d) were stimulated with LPS (0.5μg/ml), apoptotic Jurkat cells, autologous apoptotic CD4+ T cells (ac), live cells (lc), or necrotic cells (nc), (2:1 ratio of ac, lc or nc/macrophages) for indicated times, and analyzed for IL-10 production. (e) BALB/c mice (3 per group) were injected i.v. with apoptotic or necrotic Jurkat cells at doses of 2×10⁶ and 106 cells/mouse. Blood were collected and sera obtained 4 and 8 hr following the injections. Serum IL-10 levels were measured by ELISA. JKT ac, apoptotic Jurkat T cells (used in b-e); autologous ac, apoptotic splenic CD4+ T cell (b) or purified human blood CD4+ T cells (c). All data are presented as mean ± SD from a minimum of three individual donors.
Figure 2
Figure 2. p38 MAPK is crucial for apoptotic cell-induced IL-10 promoter and protein production
(a) Human IL-10 promoter (-129/+30) construct was transfected into RAW264.7 cells as described in Figure 3d. Cells were treated with SB203580 under the indicated concentrations 1 hr prior to apoptotic cell stimulation. Control cells received DMSO instead of the drug. (b-e) 0.5 × 10⁵ RAW264.7 cells (b, e) or 0.5 × 10⁵ mouse peritoneal macrophages (c) and primary human monocytes (d) were treated with SB203580 or SB202474 (b, e) at the indicated concentrations 1 hr prior to apoptotic cell stimulation (2:1 ratio of apoptotic cells/macrophages) or LPS (e). The supernatants were harvested after 12 hr and analyzed for IL-10 production. All data were presented as mean ± SD from three independent experiments.
Figure 3
Figure 3. CD36 is involved in apoptotic cell-induced IL-10 production
(a, b) 0.5 × 10⁵ WT and CD36-/- peritoneal macrophages were stimulated with either LPS or apoptotic Jurkat T cells (ac) for indicated times. Supernatants were analyzed for IL-10 (a) and TNF-α production (b). (c, d) CD36-/- and control C57BL/6 mice (3 per group) were injected i.v. with 107 apoptotic Jurkat cells. Eight hours later, 0.5 ×10⁶ peritoneal macrophages (c) were collected and cultured for 24 hrs without further stimulation, and IL-10 levels were analyzed by ELISA. (d) Peritoneal exudates in these mice were also collected for IL-10 measurement. The values represent the amount of IL-10 in the entire peritoneal exudates of each individual mouse. (e) 0.5 × 10⁵ RAW264.7cells were stimulated with apoptotic Jurkat T cells (ac) for 12 hr. Oxidized-LDL (ox-LDL) were added simultaneously with apoptotic cells at various concentrations as indicated. Cell-free supernatants were analyzed for IL-10 production. (f, g) Whole cell lysate were harvested from 2 × 10⁶ WT and CD36-/- peritoneal macrophages under the conditions indicated. Proteins were subject to SDS-PAGE analysis on a 10% polyacrylamide gel and probed with antibodies against total p38, phosphorylated p38 and phosphorylated ERK. SB; SB203580 was used at 25 μM. DS, dimethyl sulfoxide, the medium in which SB203580 was dissolved. *, p<0.05; **, p<0.01; ***, p<0.001 between WT and CD36 KO cells.
Figure 4
Figure 4. The apoptotic cell response element, ACRE, is located from (-106/-98) in the human IL-10 promoter
(a) The full-length human IL-10 promoter (-1044/+30) and various 5′ and 3′ truncation constructs linked to the firefly luciferase reporter gene were transiently transfected into RAW264.7 cells. Next day, cells were stimulated with apoptotic Jurkat T cells. Luciferase activity was measured 8 hr post stimulation. Data are expressed as fold induction relative to RAW264.7 cells not treated with apoptotic cells, and represent three independent experiments with SD. Student t test was used for statistical analysis of the comparison between two groups (specified by a bracket). *, p<0.05; **, p<0.01. (b, c) Response of the human IL-10 promoter (-129/+30) construct containing either the WT Pbx-1 binding site or its substitution mutant to apoptotic cells (c) or to LPS (d). The difference in LPS response between the two constructs in (d) was not statistically significant. Base-substitutions were made by transversion. (d) Response of the human IL-10 promoter (-129/+30) construct (reporter) containing either the WT Pbx-1 binding site or its substitution mutant cotransfected with Pbx-1a and 1b expression vector (effector) or control vector pcDNA3.1 into RAW264.7 cells by electroporation at molar ratios of 1.75:1 or 2:1 (effector:reporter). The next day, cells were stimulated with apoptotic Jurkat T cells. Luciferase activity was measured 8 hr post stimulation. (e) An identically designed experiment to (d) was carried out with two additional Hox factors, Meis-1 and Prep-1, in a molar ratio of Pbx-1b:Meis-1:Prep-1=1:1:1.
Figure 5
Figure 5. Pbx-1 is a selective physiological regulator of IL-10 production
(a) Flow cytometric analysis of in vitro generated embryonic liver-derived mouse macrophages from littermates of wild type (+/+) and homozygous Pbx-1 knockouts (-/-). The fluorescent intensity (X-axis) of F480 and CD11b staining of live cells (Y-axis) in the cultures are shown. (b) CD36 expression on macrophages derived from WT and Pbx-1-null embryos. An isotype-matched control antibody was used to set the baseline. (c) Reduced IL-10 production in Pbx-1-deficient embryonic liver-derived macrophages. After in vitro culture for 7 days, embryonic liver-derived mouse macrophages generated from littermates of wild type (+/+) and homozygous Pbx-1 knockouts (-/-) were stimulated with LPS or apoptotic Jurkat cells. Cell-free supernatant were harvested 12 hr post stimulation and assayed for various cytokine production by ELISA. The numbers of embryos used in this experiment were 3 wild type and 3 Pbx-1-null homozygotes. Phagocytosis of E. coli by embryonic-liver macrophages derived from wild type Pbx-1-/- embryonic liver was measured.
Figure 6
Figure 6. Blocking Pbx-1 expression inhibits apoptotic cell-induced IL-10 expression
(a, b) Inhibition of Pbx-1 expression by siRNA. RAW264.7 cells were transfected by Oligofectamine with siRNA specific for Pbx-1 at various concentrations as indicated, or GFP (control) at 200 nM for 4 hrs, followed by exposure to apoptotic Jurkat cells. Eight hours later, total RNA was isolated and subject to RT-PCR for the analysis of Pbx-1a, Pbx-1b, Pbx-2, Pbx-3, IL-10, and GAPDH mRNA expression (a). Whole cell lysate were isolated and subject to Western blot analysis for Pbx-1b protein level (b) using a polyclonal antibody for Pbx-1, 2, 3. (c, d) Inhibition of IL-10 expression by Pbx-1 siRNA. RAW264.7 cells were transfected with the IL-10 promoter construct by electroporation. Twelve hours later, the cells were transfected by Oligofectamine with Pbx-1 siRNA at various concentrations or the control siRNA at 200 nM for 4 hrs followed by exposure to apoptotic Jurkat cells. Luciferase activity (c) was measured 8 hr post exposure to apoptotic cells, and IL-10 protein secretion (d) was analyzed at 24 hr post stimulation.
Figure 7
Figure 7. Interaction of Pbx-1b and cofactors with ACRE
(a) EMSA analysis was performed with ACRE oligonucleotides and nuclear extracts from RAW264.7 cells with or without stimulation by apoptotic cells in the presence or absence of antibodies against members of the Pbx family, or control IgG or PBS. (b) ChIP analysis of in vivo binding to the IL-10-ACRE by Pbx-1 in RAW264.7 cells under unstimulated (med) or apoptotic cell (ac)-stimulated conditions. Control antibody (rat IgG) was used and a 230 bp region 1.3 kb upstream of the ACRE was probed as a negative control. (c) Whole cell extracts were prepared from WT and CD36-/- peritoneal macrophages following stimulation with LPS or apoptotic cells (AC). Immunoprecipitation (IP) was performed using anti-phosphotyrosine (α-pY), anti-phosphoserine (α-pS), and anti-phosphothreonine (α-pT) mAbs, followed by Western blot with anti-Pbx-1 or anti-Prep-1 Ab. The relative ratios of tyrosine phosphorylation of Prep-1 are indicated below the image. (d) ChIP analysis of in vivo binding to the IL-10-ACRE by Pbx-1, Meis-1, and Prep-1 in WT and CD36-/- peritoneal macrophages under unstimulated (med) or apoptotic cell (ac)-stimulated conditions. Control antibodies (mouse and rat IgG) were used as negative controls.

References

    1. Aderem A, Underhill DM. Mechanisms of phagocytosis in macrophages. Annu Rev Immunol. 1999;17:593–623. - PubMed
    1. Benkhart EM, Siedlar M, Wedel A, Werner T, Ziegler-Heitbrock HW. Role of Stat3 in lipopolysaccharide-induced IL-10 gene expression. J Immunol. 2000a;165:1612–1617. - PubMed
    1. Benkhart EM, Siedlar M, Wedel A, Werner T, Ziegler-Heitbrock HW. Role of Stat3 in lipopolysaccharide-induced IL-10 gene expression. J Immunol. 2000b;165:1612–1617. - PubMed
    1. Berg DJ, Kuhn R, Rajewsky K, Muller W, Menon S, Davidson N, Grunig G, Rennick D. Interleukin-10 is a central regulator of the response to LPS in murine models of endotoxic shock and the Shwartzman reaction but not endotoxin tolerance. J Clin Invest. 1995a;96:2339–2347. - PMC - PubMed
    1. Berg DJ, Leach MW, Kuhn R, Rajewsky K, Muller W, Davidson NJ, Rennick D. Interleukin 10 but not interleukin 4 is a natural suppressant of cutaneous inflammatory responses. J Exp Med. 1995b;182:99–108. - PMC - PubMed

Publication types

MeSH terms