. 2008 Feb 1;1179(2):205-15.
doi: 10.1016/j.chroma.2007.11.101. Epub 2007 Dec 3.

Comprehensive two-dimensional gas chromatography/time-of-flight mass spectrometry peak sorting algorithm

Affiliations

Comprehensive two-dimensional gas chromatography/time-of-flight mass spectrometry peak sorting algorithm

Cheolhwan Oh et al. J Chromatogr A. .

Abstract

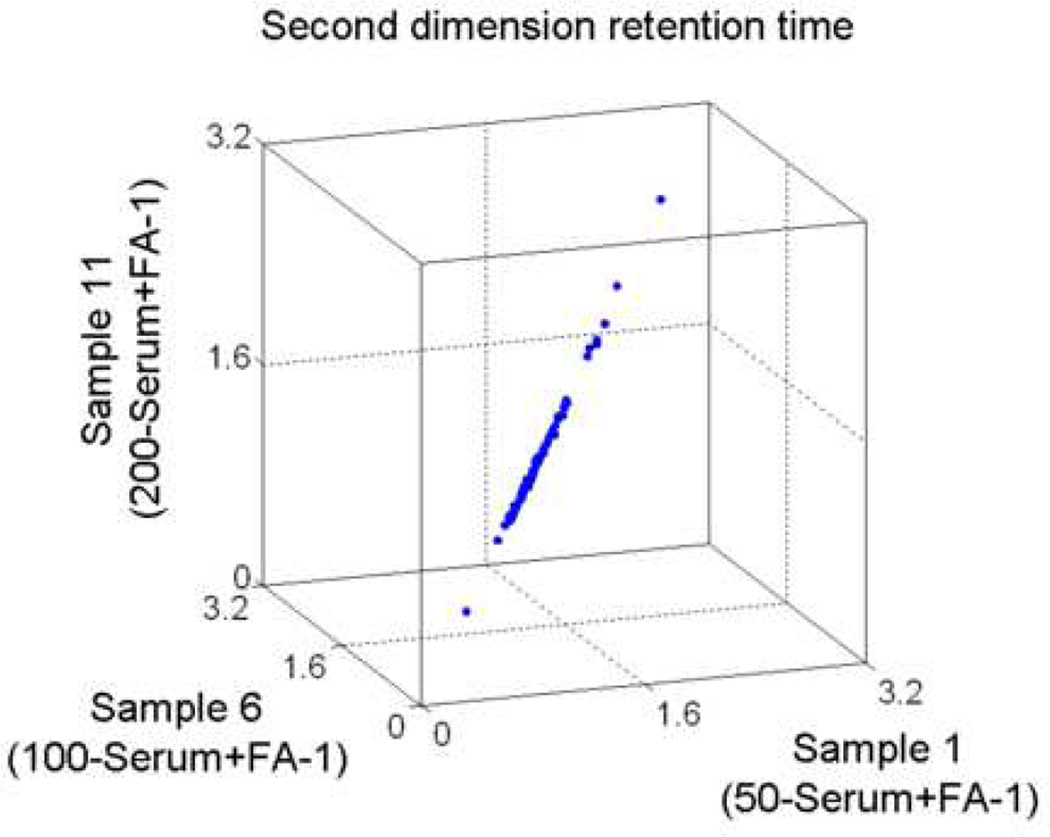
We report a novel peak sorting method for the two-dimensional gas chromatography/time-of-flight mass spectrometry (GC x GC/TOF-MS) system. The objective of peak sorting is to recognize peaks from the same metabolite occurring in different samples from thousands of peaks detected in the analytical procedure. The developed algorithm is based on the fact that the chromatographic peaks for a given analyte have similar retention times in all of the chromatograms. Raw instrument data are first processed by ChromaTOF (Leco) software to provide the peak tables. Our algorithm achieves peak sorting by utilizing the first- and second-dimension retention times in the peak tables and the mass spectra generated during the process of electron impact ionization. The algorithm searches the peak tables for the peaks generated by the same type of metabolite using several search criteria. Our software also includes options to eliminate non-target peaks from the sorting results, e.g., peaks of contaminants. The developed software package has been tested using a mixture of standard metabolites and another mixture of standard metabolites spiked into human serum. Manual validation demonstrates high accuracy of peak sorting with this algorithm.


Figures

Figure 1
Figure 1
Flow chart of MSort software. The right side provides details for information flow in the sorting step.
Figure 2
Figure 2
Three-dimensional visualization of raw GC×GC/TOF-MS data. (a) Raw data from a serum sample. (b) Three distinct peaks identified by ChromaTOF software as L-Methionine (two of these are false positives).
Figure 2
Figure 2
Three-dimensional visualization of raw GC×GC/TOF-MS data. (a) Raw data from a serum sample. (b) Three distinct peaks identified by ChromaTOF software as L-Methionine (two of these are false positives).
Figure 3
Figure 3
Receiver operating characteristic (ROC) curve (TPR: true positive rate, FPR: false positive rate). ‘Positive’ in this plot means that a pair of mass spectra is from the same metabolite. The TPR is the rate that pairs of mass spectra from the same metabolite are correctly assigned to that metabolite. The FPR is the rate that pairs of mass spectra from different metabolites are incorrectly classified arising from the same metabolites. Each point on the ROC plot has a corresponding threshold value (ThCorr). Therefore, by choosing a point on the plot, we can obtain the threshold value that achieves specific TPR and FPR.
Figure 4
Figure 4
(a) The number of peak entries in a row of the sorting table versus the number of rows in the sorting table. (b) The box plot for the peak area. The upper end of the upper whisker is the maximum of the average peak area, the upper end of the box is the upper quartile, the lower end of the box is the lower quartile, the lower end of the lower whisker is the minimum, and the bar inside the box is the median.
Figure 4
Figure 4
(a) The number of peak entries in a row of the sorting table versus the number of rows in the sorting table. (b) The box plot for the peak area. The upper end of the upper whisker is the maximum of the average peak area, the upper end of the box is the upper quartile, the lower end of the box is the lower quartile, the lower end of the lower whisker is the minimum, and the bar inside the box is the median.
Figure 5
Figure 5
Sorting results (parameter values: ΔRT1 = 0.01 ×RT1ref, ΔRT2 = 0.05 ×RT2ref, ThCorr = 0.95, SID = True).
Figure 5
Figure 5
Sorting results (parameter values: ΔRT1 = 0.01 ×RT1ref, ΔRT2 = 0.05 ×RT2ref, ThCorr = 0.95, SID = True).
Figure 5
Figure 5
Sorting results (parameter values: ΔRT1 = 0.01 ×RT1ref, ΔRT2 = 0.05 ×RT2ref, ThCorr = 0.95, SID = True).
Figure 5
Figure 5
Sorting results (parameter values: ΔRT1 = 0.01 ×RT1ref, ΔRT2 = 0.05 ×RT2ref, ThCorr = 0.95, SID = True).
Figure 6
Figure 6
Sorting results from sample 1, 6, and 11 with sorting parameter values ΔRT1 = 0.01 ×RT1ref, ΔRT2 = 0.05 ×RT2ref, ThCorr = 0.95. (a) and (b) show the first and second dimension retention times with SID = True, resp. (c) and (d) show the first and second dimension retention times with SID = False, resp.
Figure 6
Figure 6
Sorting results from sample 1, 6, and 11 with sorting parameter values ΔRT1 = 0.01 ×RT1ref, ΔRT2 = 0.05 ×RT2ref, ThCorr = 0.95. (a) and (b) show the first and second dimension retention times with SID = True, resp. (c) and (d) show the first and second dimension retention times with SID = False, resp.
Figure 7
Figure 7
Box plots of the correlation coefficients between fragment spectra. The upper end of the upper whisker is the maximum of the correlation coefficient, the upper end of the box is the upper quartile, the lower end of the box is the lower quartile, the lower end of the lower whisker is the minimum, and the bar inside the box is the median. (Parameter values: ΔRT1 = 0.01 ×RT1ref, ΔRT2 = 0.05 ×RT2ref, ThCorr = 0.95, and SID = True.)

Similar articles

Cited by

References

    1. Harrigan GG, Goodacre R, editors. Metabolic Profiling: Its Role in Biomarker Discovery and Gene Function Analysis. Boston, MA: Kluwer; 2003. p. 171.
    1. Watkins SM, German JB. Curr. Opin. Mol. Ther. 2002;4:224. - PubMed
    1. Dunckley T, Coon KD, Stephan DA. Drug Discovery Today. 2005;10:326. - PubMed
    1. Harrigan GG, Goodacre R, editors. Metabolic Profiling: Its Role in Biomarker Discovery and Gene Function Analysis. Boston, MA: Kluwer; 2003. p. 199.
    1. Dunn WB, Ellis DI. Trends Anal. Chem. 2005;24:285.

Publication types