. 2008 Jan;235(1-2):143-56.
doi: 10.1016/j.heares.2007.11.004. Epub 2007 Nov 23.

Processing F0 with cochlear implants: Modulation frequency discrimination and speech intonation recognition

Affiliations

Processing F0 with cochlear implants: Modulation frequency discrimination and speech intonation recognition

Monita Chatterjee et al. Hear Res. 2008 Jan.

Abstract

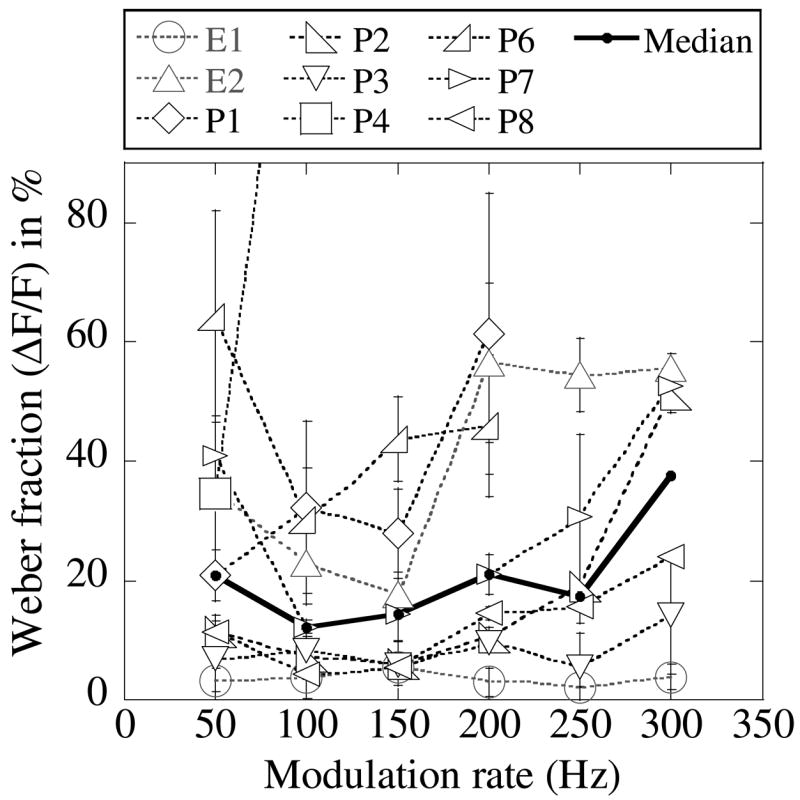
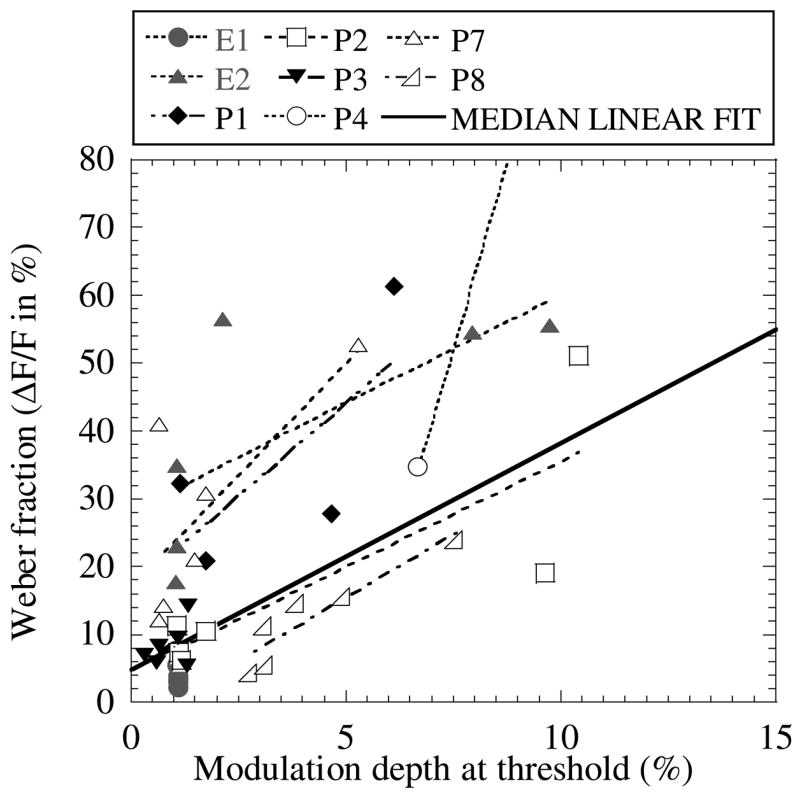
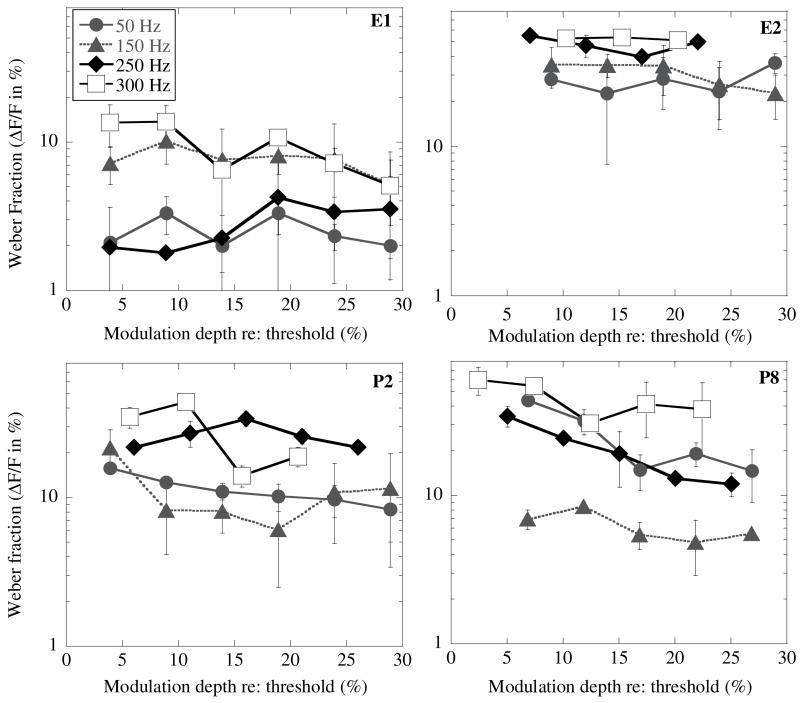
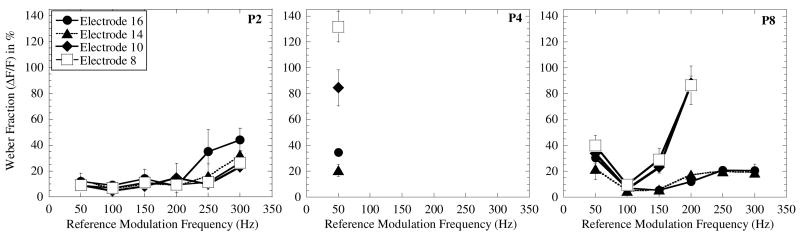
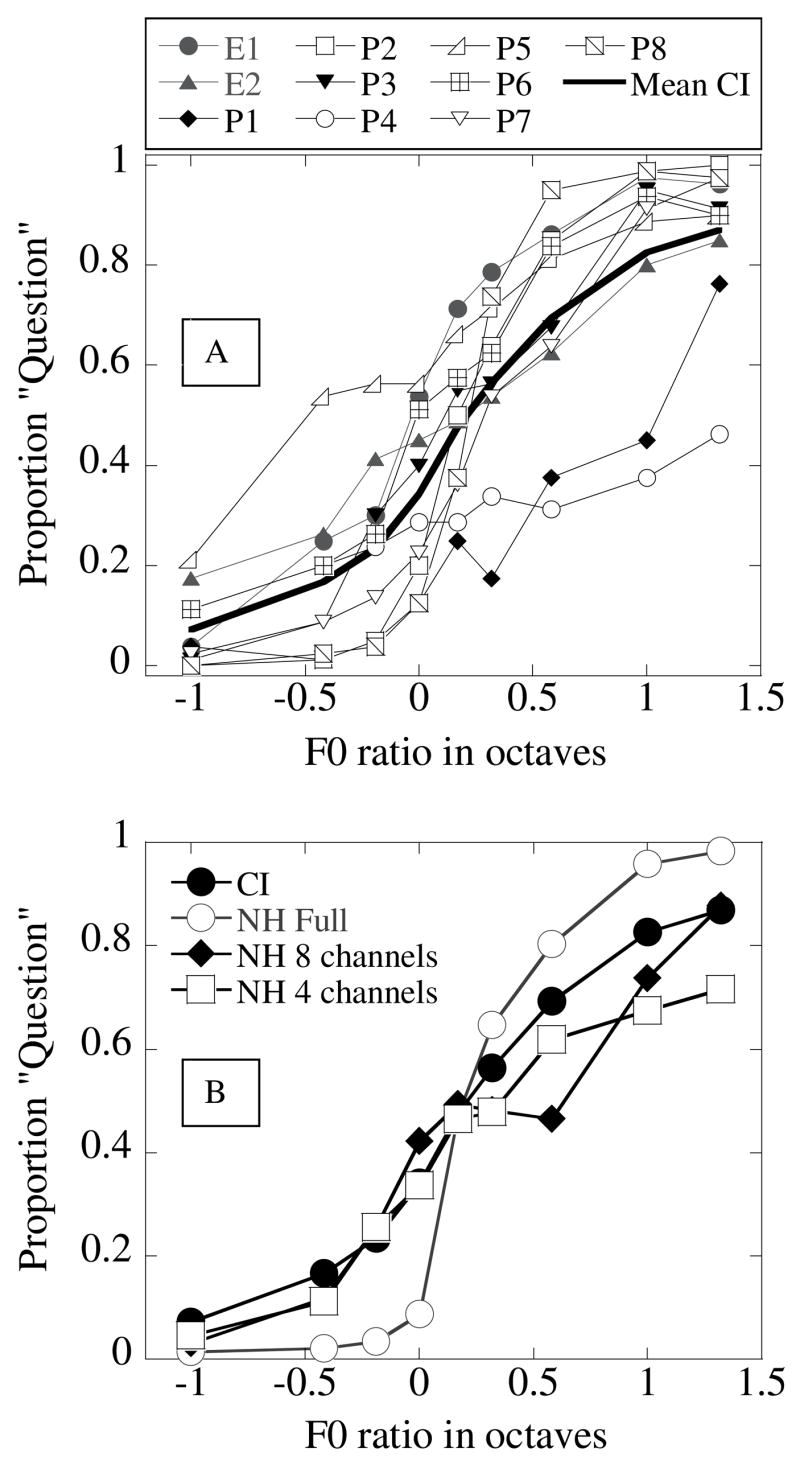
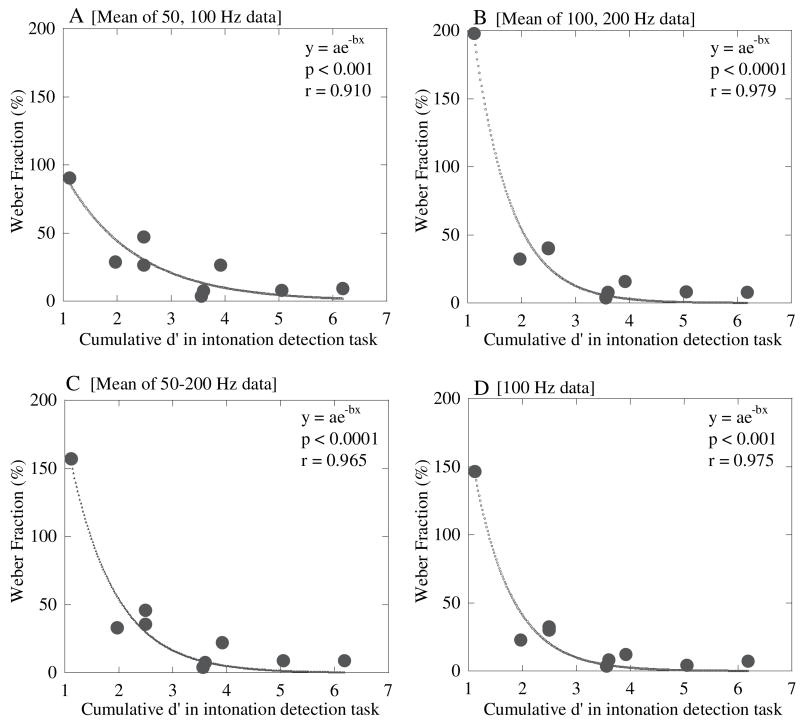
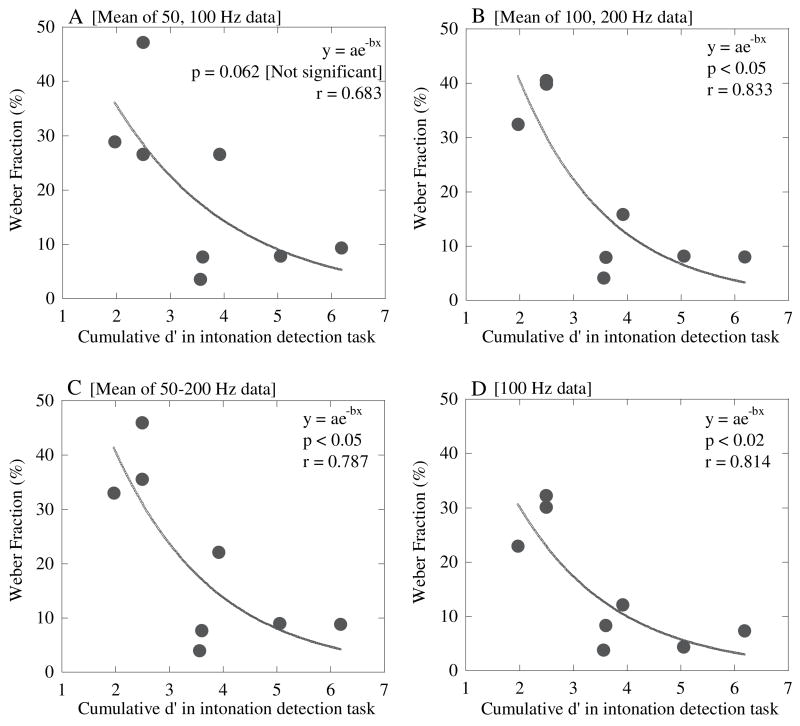
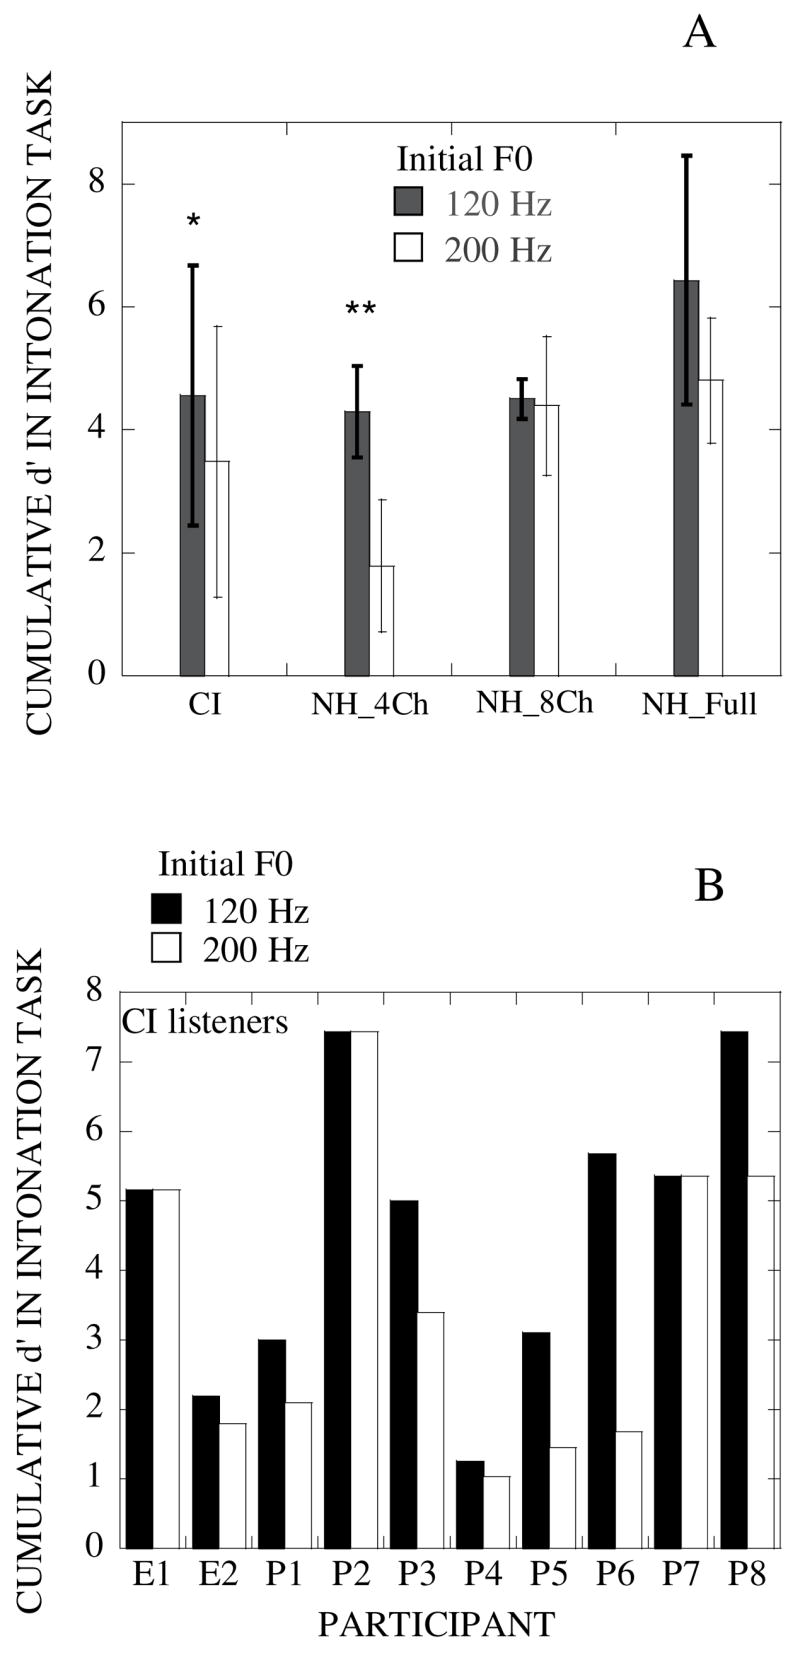
Fundamental frequency (F0) processing by cochlear implant (CI) listeners was measured using a psychophysical task and a speech intonation recognition task. Listeners' Weber fractions for modulation frequency discrimination were measured using an adaptive, 3-interval, forced-choice paradigm: stimuli were presented through a custom research interface. In the speech intonation recognition task, listeners were asked to indicate whether resynthesized bisyllabic words, when presented in the free field through the listeners' everyday speech processor, were question-like or statement-like. The resynthesized tokens were systematically manipulated to have different initial-F0s to represent male vs. female voices, and different F0 contours (i.e. falling, flat, and rising) Although the CI listeners showed considerable variation in performance on both tasks, significant correlations were observed between the CI listeners' sensitivity to modulation frequency in the psychophysical task and their performance in intonation recognition. Consistent with their greater reliance on temporal cues, the CI listeners' performance in the intonation recognition task was significantly poorer with the higher initial-F0 stimuli than with the lower initial-F0 stimuli. Similar results were obtained with normal hearing listeners attending to noiseband-vocoded CI simulations with reduced spectral resolution.


Figures

Fig. 1
Fig. 1
Weber fractions (%) plotted as a function of reference modulation frequency. Each symbol corresponds to a different subject. Results for listener P4 are not shown above the 50 Hz reference. Error bars represent +/− 1 s.d. from the mean. The thick solid line shows the median values of the results.
Fig. 2
Fig. 2
Weber fractions (%) obtained in the MFD experiment vs. threshold modulation depth (%). Each symbol shows data obtained with an individual subject; each data point corresponds to results obtained at a different modulation frequency. The intermittent lines show the linear regression to each individual subject’s data. A line with the mean intercept and slope is also indicated (solid line). Data for listener P4 were truncated.
Fig. 3
Fig. 3
Weber fractions (%) obtained in the MFD task as a function of modulation salience (the difference between modulation depth and modulation threshold). Each panel shows results obtained with a different subject. Symbols correspond to the different reference modulation frequencies (see inset in top left-hand panel).
Fig. 4
Fig. 4
Weber fractions (%) obtained in the MFD task as a function of reference modulation frequency. The parameter is electrode location (see inset). Each panel shows results obtained with a different subject. Error bars show +/− 1 s.d. from the mean.
Fig. 5
Fig. 5
Fig. 5A. Psychometric functions (proportion “question” vs. F0 ratio in octaves) obtained in the speech intonation recognition task with the 10 CI listeners. The different symbols show results obtained with individual subjects. The thick solid line shows the mean function. Fig. 5B. Mean psychometric functions obtained in the speech intonation task with CI (filled circles) and NH listeners attending to full (open circles), 8-channel (filled diamonds), and 4-channel (open squares) noiseband-vocoded speech, respectively.
Fig. 6
Fig. 6
Scatterplots showing the relation between the Weber fraction calculated in different ways and the cumulative d’ obtained from the speech intonation results in CI listeners. The line represents the best-fitting exponential function to the data.
Fig. 7
Fig. 7
Scatterplots as in Fig. 6, but excluding results obtained with P4.
Fig. 8
Fig. 8
Fig. 8A. Barplot showing the cumulative d’ calculated from results with the 120-Hz and the 200-Hz initial-F0 stimuli. Results are shown for CI listeners, and NH listeners attending to 4-channel and 8-channel noiseband-vocoded speech (NH_4Ch and NH_8Ch) and unprocessed speech (NH_Full), respectively. Single asterisks indicate a significant difference between the two sets of results at the 0.05 level: double asterisks indicate significance at the 0.01 level. Fig. 8B. Barplots showing cumulative d’ values obtained with the ten individual CI listeners for the 120-Hz and 200-Hz initial F0 stimuli (filled and patterned bars, respectively).

References

    1. Assmann PF, Summerfield Q. Modeling the perception of concurrent vowels: Vowels with different fundamental frequencies. J Acoust Soc Am. 1990;88:680–697. - PubMed
    1. Brokx JPL, Nooteboom SG. Intonation and the perceptual separation of simultaneous voices. Phonetics. 1982;10:23–36.
    1. Burns EM, Viemeister NF. Nonspectral pitch. J Acoust Soc Am. 1976;60:863–869.
    1. Carlyon RP, Deeks JM. Limitations on rate discrimination. J Acoust Soc Am. 2002;112(3 Pt 1):1009–1025. - PubMed
    1. Chatterjee M. Modulation masking in cochlear implant listeners: envelope versus tonotopic components. J Acoust Soc Am. 2003;113(4):2042–2053. - PubMed

Publication types