Review
. 2007 Oct;17(5):593-600.
doi: 10.1016/j.conb.2007.11.002.

MRI contrast agents for functional molecular imaging of brain activity

Affiliations
Review

MRI contrast agents for functional molecular imaging of brain activity

Alan Jasanoff. Curr Opin Neurobiol. 2007 Oct.

Abstract

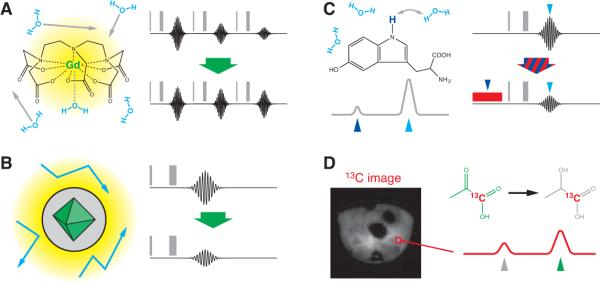
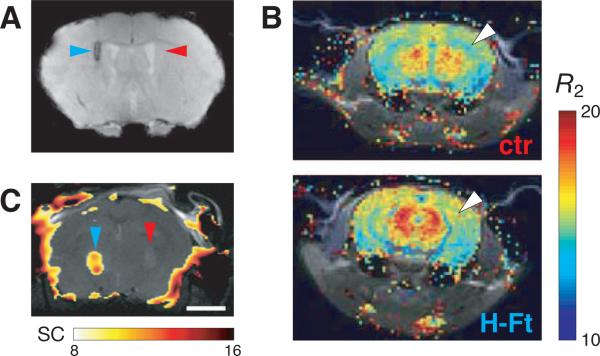
Functional imaging with MRI contrast agents is an emerging experimental approach that can combine the specificity of cellular neural recording techniques with noninvasive whole-brain coverage. A variety of contrast agents sensitive to aspects of brain activity have recently been introduced. These include new probes for calcium and other metal ions that offer high sensitivity and membrane permeability, as well as imaging agents for high-resolution pH and metabolic mapping in living animals. Genetically encoded MRI contrast agents have also been described. Several of the new probes have been validated in the brain; in vivo use of other agents remains a challenge. This review outlines advantages and disadvantages of specific molecular imaging approaches and discusses current or potential applications in neurobiology.


Figures

Figure 1
Figure 1. Contrast mechanisms in molecular MRI
Signal in MRI is proportional to the concentration of directly detected nuclei in the specimen (usually protons in water molecules), the degree to which these nuclei are polarized by the scanner's magnetic field, manipulations due to MRI acquisition schemes called pulse sequences, and the relaxation rates (T1 and T2) that determine how quickly nuclei in the specimen return to equilibrium after being manipulated by the pulse sequence. (A) Paramagnetic atoms promote T1 relaxation-based contrast in conventional MRI by interacting with water molecules (left). Gadolinium atoms (green) are effective at this because of their high electron spin (S = 7/2); Mn2+ (S = 5/2) and a variety of other metal ions may also be used. These atoms are often incorporated into chelates (Gd3+-dielthylenetriaminepentaacetic acid shown) to improve solubility and reduce toxicity. Relaxation occurs when water molecules (cyan) sample magnetic field perturbations (yellow) created by the paramagnetic atom, either through direct coordination (dotted gray line), or through space. Sensors may be constructed by making aspects of this interaction dependent on an environmental variable or molecular target. T1-weighted imaging (right) may be performed using a variety of pulse sequences. Following one or more pulses (vertical gray bars), image data are acquired in the Fourier domain (black trace). Repetition of the pulse sequence causes progressive attenuation due to saturation of the signal, toward a steady state value that determines image intensity (top right). Addition of a T1 contrast agent relieves this effect (bottom right) and leads to image brightening in areas where the contrast agent is concentrated. (B) Although most paramagnetic contrast agents induce both T1 and T2 relaxation, superparamagnetic nanoparticles including SPIOs have the highest T2 relaxivity, and relatively low T1 relaxivity. SPIOs typically contain a core of iron oxide 3−10 nm diameter (green), surrounded by a biocompatible organic coating with a total diameter of 10−100 nm (gray). Particles induce magnetic perturbations (yellow) that induce relaxation of water molecules diffusing in proximity (blue arrows). The particle size and shape of its field perturbation influence its relaxivity [54]—this relationship is the basis of sensors formed by making SPIO aggregation dependent on presence of a target molecule [55]. T2 relaxation occurs during the time between each application of the pulse sequence and acquisition of the signal (black traces, right). Addition of a T2 contrast agent causes reduction of the MRI signal (bottom right) and leads to image darkening in areas where the contrast agent is concentrated. (C) Chemical exchange saturation transfer (CEST) contrast can be produced using agents with exchangeable protons that have MRI resonance frequencies (chemical shifts) well resolved from the frequency of water molecules [5]. The example shown is the indole nitrogen proton (indigo) of 5-hydroxytryptophan. The spectrum of chemical shifts in a solution of this agent is schematized by the gray trace at the bottom left, where resonances of the CEST agent protons and water protons are indicated by indigo and cyan arrowheads, respectively. CEST contrast is produced by modifying a typical imaging pulse sequence to include a continuous saturation pulse or pulse train (red box, bottom right) matched to the frequency of the CEST protons. The saturation pulse directly decreases MRI signal due to the CEST protons (which are usually too dilute to image), but indirectly reduces signal from water protons (cyan arrowhead) because they are in exchange with the CEST proton pool. This effect leads to local darkening of MRI signal in areas where CEST agents are concentrated; contrast may be turned on and off by changing the power or frequency associated with the saturation pulse. Sensors may be based on modulation of the exchange rate or resonance frequency of labile protons on a CEST agent. (D) Contrast agents incorporating 13C, 19F, or a variety of other nuclei may be imaged directly using modified MRI hardware. Images of 13C agent distribution may be formed, analogous to standard proton images, but typically with much lower resolution and signal-to-noise ratio. Spectroscopic imaging techniques measure the distribution of species with different chemical shifts at each position in space (red trace). In experiments of Golman et al. [36], carbon resonances of 13C1-labeled pyruvate (green) and its reduction product 13C1-lactate (gray) could be distinguished using this approach (right). Relative amounts of the two species were indicative of local metabolic rate. Images like the one shown (left) were obtained only with the use of 13C-labeled agents that had been hyperpolarized to boost MRI signal, prior to imaging [37].
Figure 2
Figure 2. Genetically-encoded MRI contrast agents
(A) T2-weighted MRI contrast observed 11 days after adenoviral transfection of ferritin heavy and light chain (H-Ft and L-Ft) genes into mouse striatum (coronal section shown). Signal darkening (cyan arrowhead) was associated with Ft expression, confirmed by immunohistochemistry. Injection with control virus harboring the lacZ gene (red arrowhead) did not produce MRI signal changes. Images were obtained in a 11.7 T scanner with a resolution of 0.1 × 0.1 × 0.75 mm. Adapted from ref. [42] with permission. (B) Comparison of R2 maps (R2 = 1/T2) obtained from mice expressing H-Ft in vascular endothelial cells (bottom) with non-expressing control animals (top). Color maps show R2 values ranging from 10−20 s−1, superimposed on gray anatomical scans from the same animals at 4.7 T (234 μm in-plane resolution). Significant differences in R2 were observed in hippocampus (white arrowhead), despite the relatively low fraction of cells expressing Ft. Adapted from ref. [44] with permission. (C) A map of CEST contrast (difference in signal between on-resonance and off-resonance saturation conditions, see Figure 1C) in mouse brains containing xenografted 9L rat glioma cells expressing LRP (left, cyan arrowhead) or GFP (right, red arrowhead). CEST signal (0.56 mm in-plane resolution at 11.7 T) is expressed as percent intensity difference with respect to baseline in the brain (color scale), overlaid on a corresponding anatomical image (gray). LRP expressing tumors showed 8.2 ± 3.2% intensity difference, vs. 3.5 ± 3.3% for controls. Apparent CEST contrast outside the brain is due to magnetic field inhomogeneities, which dramatically influence results from this technique. Scale bar = 2 mm. Adapted from ref. [45] with permission.

References

    1. Belliveau JW, Kennedy DN, Jr., McKinstry RC, Buchbinder BR, Weisskoff RM, Cohen MS, Vevea JM, Brady TJ, Rosen BR. Functional mapping of the human visual cortex by magnetic resonance imaging. Science. 1991;254:716–719. - PubMed
    1. Kwong KK, Belliveau JW, Chesler DA, Goldberg IE, Weisskoff RM, Poncelet BP, Kennedy DN, Hoppel BE, Cohen MS, Turner R, et al. Dynamic magnetic resonance imaging of human brain activity during primary sensory stimulation. Proc Natl Acad Sci U S A. 1992;89:5675–5679. - PMC - PubMed
    1. Ogawa S, Tank DW, Menon R, Ellermann JM, Kim SG, Merkle H, Ugurbil K. Intrinsic signal changes accompanying sensory stimulation: functional brain mapping with magnetic resonance imaging. Proc Natl Acad Sci USA. 1992;89:5951–5955. - PMC - PubMed
    1. Jasanoff A. Functional MRI using molecular imaging agents. Trends Neurosci. 2005;28:120–126. - PubMed
    1. Ward KM, Aletras AH, Balaban RS. A new class of contrast agents for MRI based on proton chemical exchange dependent saturation transfer (CEST). J Magn Reson. 2000;143:79–87. - PubMed

Publication types