. 2008 Mar;19(3):797-806.
doi: 10.1091/mbc.e07-10-1092. Epub 2007 Dec 19.

Induction of autophagy during extracellular matrix detachment promotes cell survival

Affiliations

Induction of autophagy during extracellular matrix detachment promotes cell survival

Christopher Fung et al. Mol Biol Cell. 2008 Mar.

Abstract

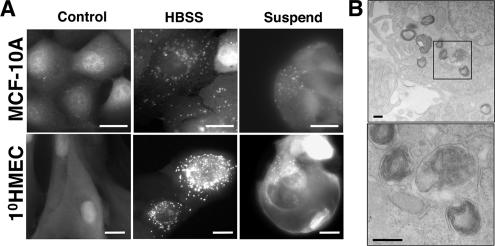
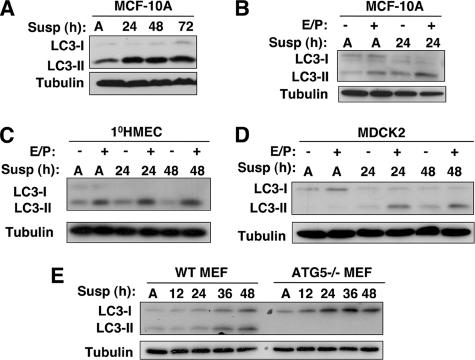
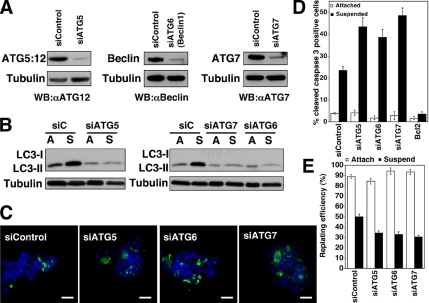
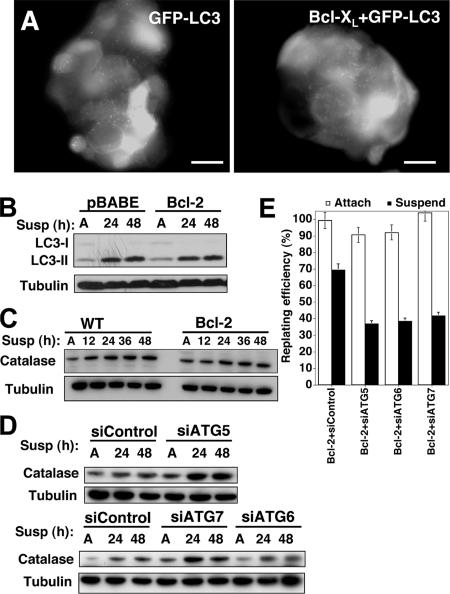
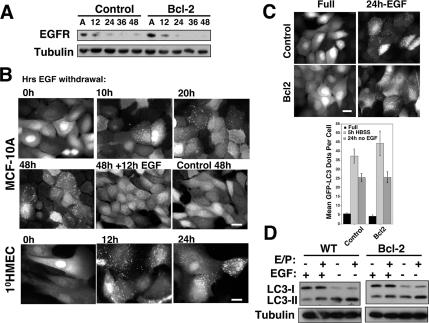
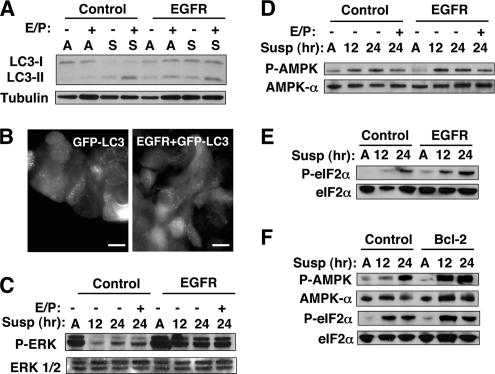
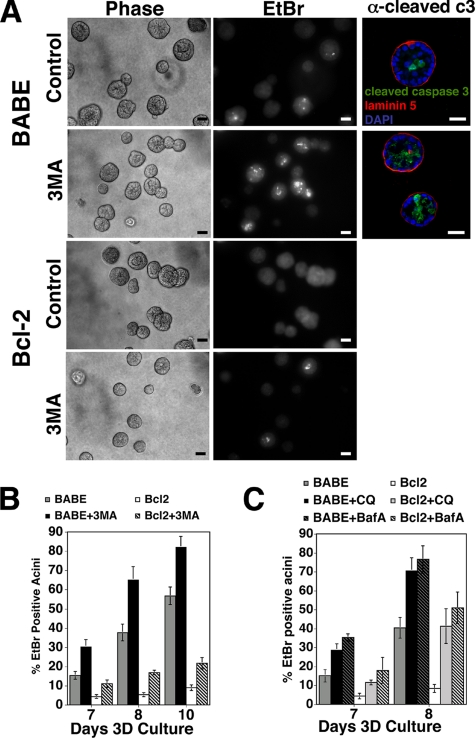
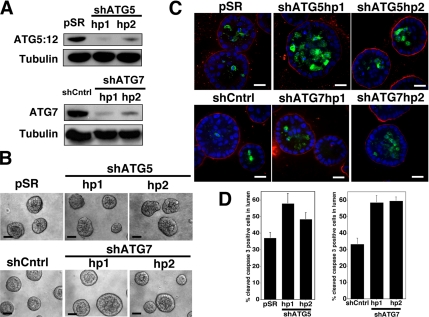
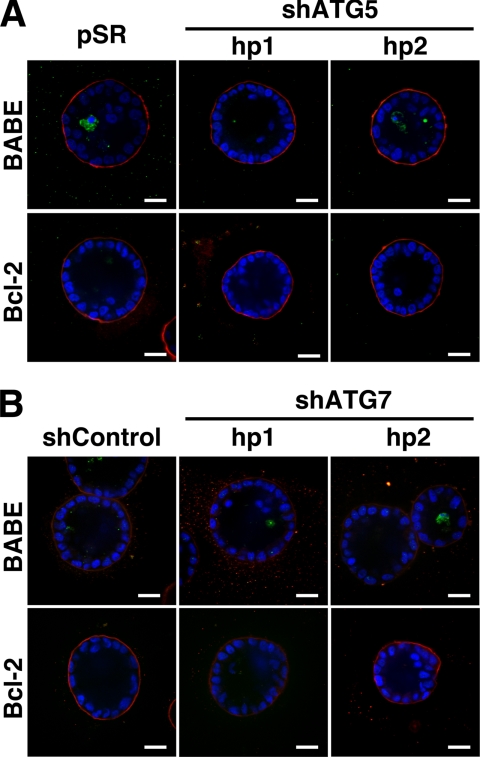
Autophagy has been proposed to promote cell death during lumen formation in three-dimensional mammary epithelial acini because numerous autophagic vacuoles are observed in the dying central cells during morphogenesis. Because these central cells die due to extracellular matrix (ECM) deprivation (anoikis), we have directly interrogated how matrix detachment regulates autophagy. Detachment induces autophagy in both nontumorigenic epithelial lines and in primary epithelial cells. RNA interference-mediated depletion of autophagy regulators (ATGs) inhibits detachment-induced autophagy, enhances apoptosis, and reduces clonogenic recovery after anoikis. Remarkably, matrix-detached cells still exhibit autophagy when apoptosis is blocked by Bcl-2 overexpression, and ATG depletion reduces the clonogenic survival of Bcl-2-expressing cells after detachment. Finally, stable reduction of ATG5 or ATG7 in MCF-10A acini enhances luminal apoptosis during morphogenesis and fails to elicit long-term luminal filling, even when combined with apoptotic inhibition mediated by Bcl-2 overexpression. Thus, autophagy promotes epithelial cell survival during anoikis, including detached cells harboring antiapoptotic lesions.


Figures

Figure 1.
Figure 1.
Substratum detachment induces autophagosome formation in human mammary epithelial cells. (A) MCF-10A cells or 1°HMECs expressing GFP-LC3 were grown attached in full growth media for 48 h (control, left column), starved with Hank's balanced salt solution for 3 h (HBSS, center), or grown detached on poly-HEMA–coated plates in complete growth media for 48 h (suspend, right). Bars, 20 μm. (B) MCF-10A cells grown detached for 24 h were analyzed by transmission electron microscopy. The boxed area in upper panel is enlarged in lower panel. Bars, 200 nm.
Figure 2.
Figure 2.
Detachment-induced autophagy in epithelial cells and fibroblasts. (A) Lysates from MCF-10A cells grown attached (A) for 48 h or suspended for the indicated times were immunoblotted with α-LC3 and α-tubulin. (B and C) MCF-10A and 1°HMEC lysates grown attached (A) or suspended for the indicated times were subject to α-LC3 and α-tubulin immunoblotting. When indicated by E/P+, E64d and pepstatin A (10 μg/ml each) were added directly to the culture 4 h before lysis. (D) Cell lysates collected from MDCK2 cells grown attached for 48 h (A) or suspended for the indicated times in complete growth media. When indicated by E/P+, E64d and pepstatin A (10 μg/ml each) were added directly to the culture 4 h before lysis. (E) Wild-type or ATG5−/− MEFs were grown attached for 48 h or detached in complete media for the indicated times. All lysates were subject to immunoblotting with α-LC3 and α-tubulin antibodies.
Figure 3.
Figure 3.
ATG depletion enhances apoptosis in ECM-detached cells. (A) MCF-10A cells transfected with pooled nontargeting control (siControl) or siRNA oligonucleotides against ATG5, ATG6 (Beclin 1), or ATG7 were lysed and immunoblotted with α-ATG12 to detect the ATG5:12 complex, α-Beclin, α-ATG7, and α-tubulin. (B) Cells transfected with the indicated siRNAs were grown attached (A) or suspended (S) for 24 h, lysed, and subjected to α-LC3 and α-tubulin immunoblotting. LC3-I detection was minimal in this experiment. (C) Confocal images of MCF-10A cells transfected with the indicated siRNAs, suspended for 24 h, fixed, and immunostained with α-cleaved caspase-3 antibody (green). Nuclei were stained with 4,6-diamidino-2-phenylindole (DAPI) (blue). Bars, 20 μm. (D) Percentage of cleaved caspase-3–positive cells in MCF-10A cells transfected with the indicated siRNAs and grown attached (white) or suspended (black) for 24 h. Results are the mean ± SEM of five or more independent experiments; in each experiment, 200–300 cells were analyzed. (E) Clonogenic replating efficiency of cells transfected with the indicated siRNAs after 48-h attachment (white) or suspension (black). Replating efficiency was calculated as the number of colonies formed divided by the number of cells originally replated. Results are the mean ± SEM from three to five independent experiments.
Figure 4.
Figure 4.
Detachment-induced autophagy in Bcl-2 expressing cells. (A) Punctate GFP-LC3 in detached MCF-10A cells stably expressing GFP-LC3 or coexpressing GFP-LC3 + Bcl-xL suspended for 24 h. Bar, 20 μm. (B) Control (BABE) or Bcl-2–expressing cells were grown attached (A) for 48 h or suspended for the indicated times, lysed, and subject to immunoblotting with α-LC3 and α-tubulin antibodies. (C) Wild-type and Bcl-2–expressing cells were grown attached (A) or suspended for the indicated times, lysed, and subject to immunoblotting with α-catalase and α-tubulin antibodies. (D) Cells transfected with the indicated siRNAs were grown attached (A) or suspended for the indicated times, lysed, and subject to immunoblotting with α-catalase and α-tubulin antibodies. (E) Clonogenic replating efficiency of Bcl-2–expressing cells transfected with the indicated siRNAs after 48 h attachment (white) or suspension (black). Replating efficiency was calculated as described previously. Results are the mean ± SEM from three to five independent experiments.
Figure 5.
Figure 5.
EGF Withdrawal induces autophagy. (A) Lysates from pBABE control and Bcl-2–expressing MCF-10A cells grown attached (A) or suspended for the indicated times were subject to immunoblotting with α-EGFR and α-tubulin. (B) GFP-LC3–expressing MCF-10A cells or 1°HMECs were grown in media lacking EGF for the indicated times. Twelve hours of EGF readdition reverses LC3 puncta formation. (C) GFP-LC3 puncta in pBABE control and Bcl-2–expressing cells after 24 h of EGF withdrawal. Bar, 20 μm. Bottom, quantification of GFP-LC3 dots per cell in control and Bcl-2 cells grown in complete growth media (black), HBSS starved for 5 h (light gray), or EGF withdrawn for 24 h (dark gray). Results are the mean ± SEM enumerated from 40 to 60 individual cells using MetaMorph (GE Healthcare) software. (D) Wild-type and Bcl-2–expressing cells were grown in complete media or media lacking EGF for 24 h, lysed, and subject to immunoblotting with α-LC3 and α-tubulin.
Figure 6.
Figure 6.
Detachment-induced autophagy in cells overexpressing EGFR. (A) Control (LPCX) and EGFR-expressing cells were grown attached (A) or suspended (S) for 24 h, lysed, and subject to immunoblotting with α-LC3 and α-tubulin. (B) Punctate GFP-LC3 in detached MCF-10A cells stably expressing GFP-LC3 or GFP-LC3 + EGFR suspended for 24 h. Bar, 20 μm. (C) Control (LPCX) and EGFR-overexpressing cells grown attached (A) or suspended for the indicated times, were lysed and subject to immunoblotting with α-P-ERK1/2, α-ERK1 + 2 (D) Control (LPCX) and EGFR-overexpressing cells grown attached (A) or suspended for the indicated times, lysed, and subjected to immunoblotting with α-P-AMPK, and α-AMPKα. (E) Control (LPCX) and EGFR-overexpressing cells grown attached (A) or suspended for the indicated times, lysed, and subjected to immunoblotting with α-P-eIF2α and α-eIF2α. (F) Control (pBABE) and Bcl-2–expressing cells were grown attached of suspended for the indicated times, lysed, and subjected to immunoblotting for the indicated antibodies. In A, C, and D, the E/P + lanes indicate E64d and pepstatin A added directly to the culture 4 h before lysis.
Figure 7.
Figure 7.
Increased luminal cell death in 3D acini upon chemical autophagy inhibition. (A) Indicated cell types were cultured for 6 d on Matrigel upon which 3-MA (10 mM) was added for 2 d. Representative fields of EtBr stained day 8 acini (middle) and corresponding phase contrast images (left) are shown. Bar, 20 μm. Right, day 8 acini were immunostained with α-cleaved caspase-3 (green) and α-laminin-5 (red). DAPI-stained equatorial confocal cross-sections are shown. Bar, 20 μm. (B) After 6 d of 3D culture, 3-MA (10 mM) was added to the indicated cell types; the percentage of acini containing EtBr-positive cells was enumerated on subsequent days. Results are the mean ± SEM of four independent experiments. (C) After 6 d of 3D culture, CQ (20 μM) or BafA (20 nM) was added to the indicated cell types; the percentage of acini containing EtBr-positive cells was enumerated on subsequent days. Results are the mean ± SEM of three independent experiments.
Figure 8.
Figure 8.
Effect of Stable ATG5 or ATG7 depletion on luminal apoptosis. (A) Top, MCF-10A cells were infected with retrovirus encoding an empty control vector (pSR) or two independent small hairpin RNAs to knockdown ATG5 (shATG5 hp1 and 2). Bottom, MCF-10A cells were infected with lentiviral particles expressing a nontargeting hairpin (shCntrl) or two independent small hairpin RNAs to knockdown ATG7 (shATG7 hp1 and 2). Lysates were immunoblotted with α-ATG7 and α-tubulin. (B) Representative phase contrast images of acini generated from control (pSR or shCntrl), shATG5 (hp 1 and 2), and shATG7 (hp1 and 2) cells after 18 d of 3D culture. Bar, 20 μm. (C) Indicated cell types grown in 3D for 12 d were immunostained for α-cleaved caspase-3 (green), α-laminin-5 (red), and counterstained with DAPI to detect nuclei (blue). Confocal cross sections of equators are shown. Bar, 20 μM. (D) Acini from the indicated cell types were fixed and immunostained on day 12 as illustrated in C. Cells occupying the lumen were defined as those lacking direct contact with basement membrane as delineated by laminin 5 staining. The percentage of cells positive for cleaved caspase-3 (mean ± SEM) was counted in 99 acini obtained from three independent 3D culture experiments.
Figure 9.
Figure 9.
Effect of stable ATG5 or ATG7 depletion on lumen formation. (A and B) Day 20 acini from the indicated cell types grown were immunostained for α-cleaved caspase-3 (green), α-laminin-5 (red), and counterstained with DAPI to detect nuclei (blue). Confocal equatorial cross-sections are shown. Bar, 20 μm.

Similar articles

Cited by

References

    1. Boya P., et al. Inhibition of macroautophagy triggers apoptosis. Mol. Cell Biol. 2005;25:1025–1040. - PMC - PubMed
    1. Chambers A. F., Groom A. C., MacDonald I. C. Dissemination and growth of cancer cells in metastatic sites. Nat. Rev. Cancer. 2002;2:563–572. - PubMed
    1. Debnath J., Baehrecke E. H., Kroemer G. Does autophagy contribute to cell death? Autophagy. 2005;1:e10–e18. - PubMed
    1. Debnath J., Brugge J. S. Modelling glandular epithelial cancers in three-dimensional cultures. Nat. Rev. Cancer. 2005;5:675–688. - PubMed
    1. Debnath J., Mills K. R., Collins N. L., Reginato M. J., Muthuswamy S. K., Brugge J. S. The role of apoptosis in creating and maintaining luminal space within normal and oncogene-expressing mammary acini. Cell. 2002;111:29–40. - PubMed

Publication types

MeSH terms

LinkOut - more resources