Comparative Study
. 2007 Dec 19;27(51):13926-37.
doi: 10.1523/JNEUROSCI.3520-07.2007.

Plasticity of intrinsic excitability during long-term depression is mediated through mGluR-dependent changes in I(h) in hippocampal CA1 pyramidal neurons

Affiliations
Comparative Study

Plasticity of intrinsic excitability during long-term depression is mediated through mGluR-dependent changes in I(h) in hippocampal CA1 pyramidal neurons

Darrin H Brager et al. J Neurosci. .

Abstract

Bidirectional changes in synaptic strength are the proposed cellular correlate for information storage in the brain. Plasticity of intrinsic excitability, however, may also be critical for regulating the firing of neurons during mnemonic tasks. We demonstrated previously that the induction long-term potentiation was accompanied by a persistent decrease in CA1 pyramidal neuron excitability (Fan et al., 2005). We show here that induction of long-term depression (LTD) by 3 Hz pairing of back-propagating action potentials with Schaffer collateral EPSPs was accompanied by an overall increase in CA1 neuronal excitability. This increase was observed as an increase in the number of action potentials elicited by somatic current injection and was caused by an increase in neuronal input resistance. After LTD, voltage sag during hyperpolarizing current injections and subthreshold resonance frequency were decreased. All changes were blocked by ZD7288 (4-ethylphenylamino-1,2-dimethyl-6-methylaminopyrimidinium chloride), suggesting that a physiological loss of dendritic h-channels was responsible for the increase in excitability. Furthermore, block of group 1 metabotropic glutamate receptors (mGluRs) or protein kinase C prevented the increase in excitability, whereas the group 1 mGluR agonist DHPG [(RS)-3,5-dihydroxyphenylglycine] mimicked the effects. We conclude that 3 Hz synaptic stimulation downregulates I(h) via activation of group 1 mGluRs and subsequent stimulation of protein kinase C. We propose these changes as part of a homeostatic and bidirectional control mechanism for intrinsic excitability during learning.


Figures
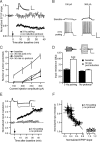
Figure 1.
Figure 1.
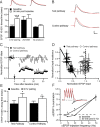
3 Hz pairing of b-APs and EPSPs produces LTD and a persistent increase in neuronal excitability and input resistance. A, Graph showing the time course and magnitude of the change in EPSP slope after either 3 Hz pairing (●; n = 20) or whole-cell control (○; n = 7). Note that 3 Hz pairing consisted of a 5 min train of 900, b-AP–EPSP pairs (↓). The inset shows representative EPSPs during the baseline period (black) and 30 min after 3 Hz pairing (gray). Calibration: 3 mV, 50 ms. B, Representative voltage recordings during a 500 ms injection of either 100 or 300 pA before (black) and 30 min after (gray) 3 Hz pairing. Calibration: 50 mV, 200 ms. C, Summary data showing action potential firing elicited by somatic current injection before (●) and 30 min after (○) 3 Hz pairing (n = 5). There was no significant change in AP firing in the absence of 3 Hz pairing (baseline, ▾; 30 min, ▿). D, Summary data showing increased RN 30 min after 3 Hz pairing (n = 20) but not during whole-cell control recordings (n = 10). Inset, Representative voltage deflections in response to a series of current steps (−40 to +40 pA) before (black) and 30 min after 3 Hz pairing (gray). Calibration: 3 mV, 250 ms. E, Graph showing the time course and magnitude of the change in input resistance after either 3 Hz pairing (●; n = 13) or whole-cell control (○; n = 7). Inset, Representative traces before (black) and after (gray) 3 Hz pairing showing both EPSP depression and increased input resistance after 3 Hz pairing. Note that for these measurements, input resistance was measured by a single −50 pA injection. Calibration: 5 mV, 150 ms. F, Relationship between RN and EPSP slope after either 3 Hz pairing (●; n = 13) or in the absence of the 3 Hz protocol (○; n = 7). There was a strong linear correlation (r = −0.86) between RN slope and EPSP slope after 3 Hz pairing. Error bars indicate SEM. *p < 0.05; ***p < 0.005 baseline versus 30 min after 3 Hz pairing.
Figure 2.
Figure 2.
Blockade of h-channels occluded the increase in excitability but had no effect on synaptic depression. A, Graph showing the time course and magnitude of EPSP depression from control slices (●; n = 20) and when 20 μm ZD7288 was included in the recording pipette (○; n = 5). Inset, Representative traces from the baseline (black) and 30 min after 3 Hz pairing (gray) showing that pairing still produced depression of EPSPs with intracellular ZD7288 (20 μm). Calibration: 2 mV, 25 ms. B, The relationship between RN and EPSP slope after 3 Hz pairing from control experiments (●) and with ZD7288 in the recording pipette (○). Note that there was still depression of EPSP slope with ZD7288, but no increase in RN. C, Summary graph showing that 3 Hz pairing did not further increase RN when h-channels were blocked with ZD7288. D, Summary graph showing RN measured during baseline, 30 min after 3 Hz pairing, and 30 min after extracellular application of ZD7288 (60 min after 3 Hz pairing; n = 4). For comparison, the RN from a separate group of cells treated with extracellular ZD7288 only (no pairing) is shown (n = 4 cells). Error bars indicate SEM. *p < 0.05; ***p < 0.005.
Figure 3.
Figure 3.
Increases in temporal summation accompany 3 Hz pairing induced LTD. A, Summary graph showing that the 10–90% decay time of EPSPs was increased after 3 Hz pairing in control experiments (n = 20), but not with ZD7288 in the recording pipette (n = 5) or in whole-cell control experiments (n = 7). Inset, Representative traces from 3 Hz pairing (left) and whole-cell control experiments (right). Black traces are from the baseline period and red traces are from 30 min later. Note 30 min traces are scaled to the peak of the baseline traces to highlight changes in EPSP decay. B, Representative traces showing EPSPs before (black) and after (red) 3 Hz pairing elicited from the test and control pathways onto the same cell. Note the increased decay in both the test and control EPSPs after 3 Hz pairing. Calibration: 2 mV, 25 ms. C, Group data showing LTD of the test (●), but not the control (○) pathway (n = 4). The (↓) indicates the time of 3 Hz pairing. D, Relationship between the increase in input resistance and EPSP slope for both the test (●) and control (○) pathways. E, Summary data showing that EPSP 10–90% decay is significantly increased after 3 Hz pairing for both the test and control pathways. F, Summary graph showing summation of αEPSPs before (●) and after (○) 3 Hz pairing (n = 4). There was a significant increase in summation at 10 and 20 Hz. Note a reduction in the undershoot (↓) after 3 Hz pairing indicative of a decrease in Ih. Inset, Representative traces showing αEPSP summation at 20 Hz before (black) and after (red) 3 Hz pairing. Traces are scaled to the first αEPSP to illustrate change in summation. Error bars indicate SEM. *p < 0.05; ***p < 0.005 baseline versus 30 min after 3 Hz pairing.
Figure 4.
Figure 4.
Electrophysiological measurements sensitive to Ih are altered after 3 Hz pairing. A, Representative voltage traces in response to a series of hyperpolarizing current injections (0 to −200 pA) during the baseline period and 30 min after 3 Hz pairing. The traces on the right show current injections that produced the same maximum voltage deflection before and after 3 Hz pairing. Note that the prominent sag present before is significantly reduced after (▾). Calibration: 5 mV, 200 ms. B, Summary graph showing decreased sag 30 min after 3 Hz pairing (n = 10), but not in whole-cell control experiments (n = 10). C, Representative voltage traces during injection of the ZAP stimulus before and 30 min after 3 Hz pairing. The bottom trace shows the ZAP current stimulus. D, Impedance amplitude profile showing a leftward shift of the maximum impedance after 3 Hz pairing. E, Summary graph showing that resonance frequency is decreased after 3 Hz pairing (n = 9), but not whole-cell controls (n = 3). Error bars indicate SEM. *p < 0.05; ***p < 0.005 baseline versus 30 min after 3 Hz pairing.
Figure 5.
Figure 5.
Voltage dependence of the changes in input resistance, rebound potential, and resonance frequency after 3 Hz pairing suggest a decrease in Ih. A, Representative traces showing the measurement of RN before (black) and after (red) 3 Hz pairing at the indicated membrane potentials. Note the lack of change at −64 mV compared with −82 mV. Calibration: 2 mV, 150 ms. B, Summary graph showing the normalized change in input resistance as a function of membrane potential (n = 5). There was a strong negative correlation between the change in RN and membrane potential (linear fit, solid line; confidence bands, dashed lines). C, Representative traces showing the rebound potential amplitude before (black) and after (red) 3 Hz pairing. The bottom traces are expanded from the indicated region above. Calibration: top, 4 mV, 100 ms; bottom, 3 mV, 25 ms. D, Summary graph showing rebound potential amplitude as a function of membrane potential before (●) and after (red filled circle) 3 Hz pairing. The intersection of the lines occurs near the holding potential of the neuron. E, Representative graph showing the impedance amplitude profile measured at three membrane potentials (black, −63 mV; red, −71 mV; green, −82 mV). Note the rightward shift of the maximum impedance consistent with an increase in resonance frequency (dashed lines). F, Summary graph showing measured resonance frequency as a function of membrane potential before (●) and after (red filled circle) 3 Hz pairing (n = 5). Solid lines fits of experimental data by the first derivative of the Boltzmann. Inset, Fits of the experimental data shown across the voltages used during the simulations in supplemental Figure 2 (available at www.jneurosci.org as supplemental material). Error bars indicate SEM.
Figure 6.
Figure 6.
Rises in intracellular calcium and metabotropic glutamate receptor activation are necessary for the increase in excitability after 3 Hz pairing. A, Graph showing the time course and magnitude of the change in EPSP slope after 3 Hz pairing (↓) with control intracellular saline (●) and 20 mm BAPTA in the recording pipette (○; n = 4). B, Summary graph showing input resistance measured before and 30 min after 3 Hz pairing with control intracellular saline, 20 mm intracellular BAPTA, and with control intracellular saline but not 3Hz pairing protocol. C, Graph showing the time course and magnitude of the change in EPSP slope after 3 Hz pairing (↓) in control saline (●), with NMDA receptors blocked by 50 μm APV + 10 μm MK-801 (▾); n = 8, and with group 1 mGluRs blocked with 100 μm LY341495 (n = 5). D, Graph showing the time course and magnitude of the change in input resistance after 3 Hz pairing (↓) in control saline (●), in the presence of APV/MK-801 (▾), and in the presence of LY341495 (○). E, Summary graph showing input resistance measured before and 30 min after 3 Hz pairing in control saline, APV/MK-801, and LY341495. F, Relationship between RN and EPSP slope after 3 Hz pairing in control saline (●), in the presence of APV/MK-801 (▾), and in the presence of LY341495 (○). Error bars indicate SEM. **p < 0.01; ***p < 0.005 baseline versus 30 min after 3 Hz pairing.
Figure 7.
Figure 7.
Decreases in Ih persist with ionotropic glutamate receptors blocked during 3 Hz pairing. A, Representative traces of EPSPs (top) and input resistance (bottom, hyperpolarizing voltage deflections in response to −50 pA) in control saline (baseline), with 10 μm CNQX, 50 μm APV, and 10 μm MK-801 present to block ionotropic glutamate receptors, and 30 min after 3 Hz pairing (gray). There was no significant change in RN after wash in of CNQX/APV/MK-801. Calibration: 4 mV, 75 or 200 ms (for EPSP and RN traces respectively). B, Summary graph showing the normalized change in RN 30 min after 3 Hz pairing in the four experimental groups (control saline, n = 20; CNQX/APV/MK-801, n = 4; LY341495, n = 5; no induction protocol, n = 7). C, Representative impedance amplitude profiles before (black) and after (gray) 3 Hz pairing from four types of experiments: control (top left), with ionotropic glutamate receptors blocked (top right), without 3 Hz pairing (bottom left), and with metabotropic glutamate receptors blocked (bottom right). The dashed lines indicate the maximum impedance (resonance frequency). D, Summary graph showing the normalized change in resonance frequency 30 min after 3 Hz pairing in the four experimental groups. Error bars indicate SEM. Solid lines, p < 0.05; dashed lines, p > 0.05.
Figure 8.
Figure 8.
DHPG application mimics the 3 Hz pairing effects on intrinsic excitability. A, Summary data showing that block of action potentials with TTX or NMDA receptors with APV reveals an mGluR-dependent increase in input resistance. B, Representative recording showing the change in CA1 pyramidal neuron excitability that occurs during and after a 10 min application of DHPG (100 μm). Arrows indicate the time of the baseline and post DHPG measurements. The downward deflection near the end of the trace was caused by a brief increase in holding current to monitor series resistance. Calibration: 40 mV, 500 s. C, Representative impedance amplitude profile before (black) and after (gray) a 10 min application of 100 μm DHPG in the presence of APV/MK-801 produced a leftward shift of the resonance frequency (dashed lines). D, Summary data showing the change in input resistance, sag, and resonance frequency 30 min after 10 min DHPG application (n = 5). E, Summary graph showing rebound potential amplitude as a function of membrane potential before (●) and after (○) DHPG application. Error bars indicate SEM. *p < 0.05 versus baseline.
Figure 9.
Figure 9.
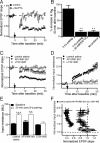
The decrease in Ih requires only synaptic stimulation and the activation of protein kinase C. A, Graph showing the time course and magnitude of the change in EPSP slope after 3 Hz pairing (●), a 3 Hz train of b-APs alone (▾; n = 5), and a 3 Hz train of synaptic stimulation alone (○; n = 7). B, Summary data showing the change in input resistance (RN) 30 min after the indicated protocol. All data are expressed as mean ± SEM. **p < 0.01; ***p < 0.005 baseline versus 30 min post 3 Hz protocol. C, Graph showing the time course and magnitude of the change in EPSP slope after 3 Hz pairing in control saline (●) and in the presence of 10 μm GF109203X (○; n = 5). D, Representative impedance amplitude profile before (black) and after (gray) 3 Hz pairing in the presence of GF109203X. E, Summary data showing the change in input resistance, sag, and resonance frequency 30 min after 3 Hz pairing in control saline and in the presence of GF109203X. Error bars indicate SEM *p < 0.05; **p < 0.01 control saline versus GF109203X.

References

    1. Abbott LF, Nelson SB. Synaptic plasticity: taming the beast. Nat Neurosci. 2000;3(Suppl):1178–1183. - PubMed
    1. Abe T, Sugihara H, Nawa H, Shigemoto R, Mizuno N, Nakanishi S. Molecular characterization of a novel metabotropic glutamate receptor mGluR5 coupled to inositol phosphate/Ca2+ signal transduction. J Biol Chem. 1992;267:13361–13368. - PubMed
    1. Abraham WC, Gustafsson B, Wigström H. Long-term potentiation involves enhanced synaptic excitation relative to synaptic inhibition in guinea-pig hippocampus. J Physiol (Lond) 1987;394:367–380. - PMC - PubMed
    1. Abraham WC, Mason-Parker SE, Bear MF, Webb S, Tate WP. Heterosynaptic metaplasticity in the hippocampus in vivo: a BCM-like modifiable threshold for LTP. Proc Natl Acad Sci USA. 2001;98:10924–10929. - PMC - PubMed
    1. Aizenman CD, Linden DJ. Rapid, synaptically driven increases in the intrinsic excitability of cerebellar deep nuclear neurons. Nat Neurosci. 2000;3:109–111. - PubMed

Publication types

MeSH terms

Substances

LinkOut - more resources