. 2008 Jan;64(Pt 1):49-60.
doi: 10.1107/S0907444907047580. Epub 2007 Dec 5.

ARP/wARP and molecular replacement: the next generation

Affiliations

ARP/wARP and molecular replacement: the next generation

Serge X Cohen et al. Acta Crystallogr D Biol Crystallogr. 2008 Jan.

Abstract

Automatic iterative model (re-)building, as implemented in ARP/wARP and its new control system flex-wARP, is particularly well suited to follow structure solution by molecular replacement. More than 100 molecular-replacement solutions automatically solved by the BALBES software were submitted to three standard protocols in flex-wARP and the results were compared with final models from the PDB. Standard metrics were gathered in a systematic way and enabled the drawing of statistical conclusions on the advantages of each protocol. Based on this analysis, an empirical estimator was proposed that predicts how good the final model produced by flex-wARP is likely to be based on the experimental data and the quality of the molecular-replacement solution. To introduce the differences between the three flex-wARP protocols (keeping the complete search model, converting it to atomic coordinates but ignoring atom identities or using the electron-density map calculated from the molecular-replacement solution), two examples are also discussed in detail, focusing on the evolution of the models during iterative rebuilding. This highlights the diversity of paths that the flex-wARP control system can employ to reach a nearly complete and accurate model while actually starting from the same initial information.


Figures

Figure 1
Figure 1
A schematic view of the graph that is used in flex-wARP to automatically build a model from a molecular-replacement solution. The three different ways a molecular-replacement model can be used as input to the control system are represented in the top left corner. Round-edged boxes correspond to decisions taken at run-time. Arrows connecting the decision nodes correspond to one or a set of actions to be taken on the current model; similarly coloured arrows correspond to the same action set.
Figure 2
Figure 2
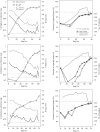
The evolution of the quality and completeness indicators as flex-wARP iteratively completes, edits and refines a model for the Ubc9–SUMO complex. The left panels represent the evolution of R work and R free (plain thin lines in black and grey, respectively), with corresponding values from the reference shown as dashed horizontal lines. The thick grey line corresponds to the correlation of the current likelihood-weighted map to the reference electron-density map. The right panels show the completeness of the model over iteration: a thin grey line presents the number of atoms in the current model compared with the number in the reference structure. The thin black and thick grey lines correspond to the number of built residues and the number of residues assigned to the sequence (hence having their side chain built), respectively. In all panels, marks (triangles and cross) represents the steps where main-chain tracing, sequence docking and side-chain building are performed. The top two panels correspond to the default protocol starting from the molecular-replacement model (§2.2). The middle panels correspond to the protocol that starts from the coordinates alone (removing all the restraints, as described in §2.3). Finally, the bottom two panels represent the results obtained by the protocol starting from the electron density alone (described in §2.4).
Figure 3
Figure 3
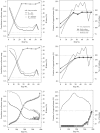
The evolution of the quality and completeness indicators as flex-wARP iteratively edits and refines a model for the SMR. The legend is the same as for Fig. 2 ▶. Note that the bottom right figure uses a different y scale than the top two figures: the number of generated atoms increases to more than 220% of the expected number of atoms.
Figure 4
Figure 4
Box plot of the results of flex-wARP (running in default mode, keeping the initial model). The data sets were divided into five groups based either on the initial R factor (left column) or its high-resolution limit (right column). The boundaries of each group are labelled on the x axis. In each category the relative width of the box corresponds to the number of data sets in the category; the box itself spans vertically from the first to the third quartiles, whilst the bold line is situated at the median; whiskers represent the full spread of the distribution, whilst open circles represent outliers. The top two graphs represent the fraction of residues built (white boxes) and the fraction of residues assigned to sequence (hence having side chain built; grey boxes). The bottom two graphs give the values of the correlation of the map obtained by flex-wARP with the reference map.
Figure 5
Figure 5
Box plot of the difference between the results obtained with the default protocol and those obtained using only starting-model coordinates (top two figures) and those using the starting model only to compute an electron-density map (bottom figures). The grouping is the same as that used in Fig. 4 ▶ (using the R factor of the molecular-replacement solution on the left and considering the high-resolution limit on the right). Here, we represent the difference in the fraction of residues built (white boxes) and assigned to sequence (grey boxes).
Figure 6
Figure 6
The quality of the final map-quality predictor. On the left hand side, a scatter plot is shown of the predicted value versus the true value of the map correlation at the end of the flex-wARP run with the reference map. On the right-hand side, a box plot shows the fraction of the residues built (white boxes) and the fraction assigned to sequence (grey boxes). In this box plot, the data sets are grouped by predicted final map quality. Note that the groups have irregular spacing in order to have approximately the same number of data sets per group.
Figure 7
Figure 7
The percentage of case studies for which any of the three protocols described in §2 are significantly better (more than 5% discrepancy) than any other protocol and of cases in which the choice of protocol makes no difference or at least two protocols perform similarly.

References

    1. Banci, L. et al. (2006). Acta Cryst. D62, 1208–1217. - PubMed
    1. Cohen, S. X., Morris, R. J., Fernandez, F. J., Ben Jelloul, M., Kakaris, M., Parthasarathy, V., Lamzin, V. S., Kleywegt, G. J. & Perrakis, A. (2004). Acta Cryst. D60, 2222–2229. - PubMed
    1. Cowtan, K. (2006). Acta Cryst. D62, 1002–1011. - PubMed
    1. Emsley, P. & Cowtan, K. (2004). Acta Cryst. D60, 2126–2132. - PubMed
    1. Ioerger, T. R. & Sacchettini, J. C. (2003). Methods Enzymol.374, 244–270. - PubMed

Publication types

Substances