. 2008 Mar;22(3):521-9.
doi: 10.1038/sj.leu.2405066. Epub 2007 Dec 20.

The role of the proto-oncogene ETS2 in acute megakaryocytic leukemia biology and therapy

Affiliations

The role of the proto-oncogene ETS2 in acute megakaryocytic leukemia biology and therapy

Y Ge et al. Leukemia. 2008 Mar.

Abstract

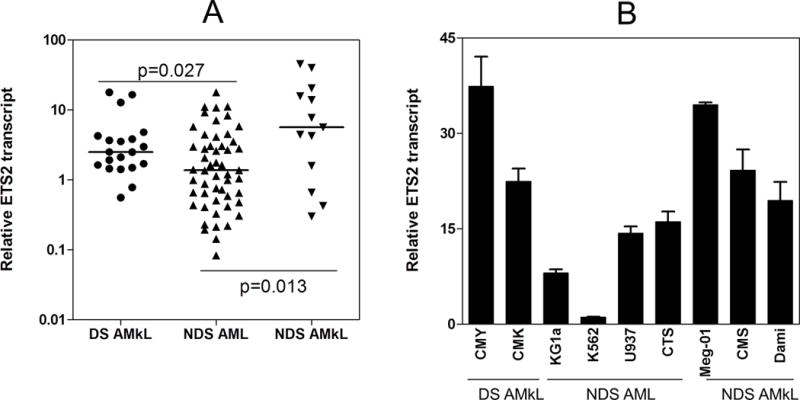
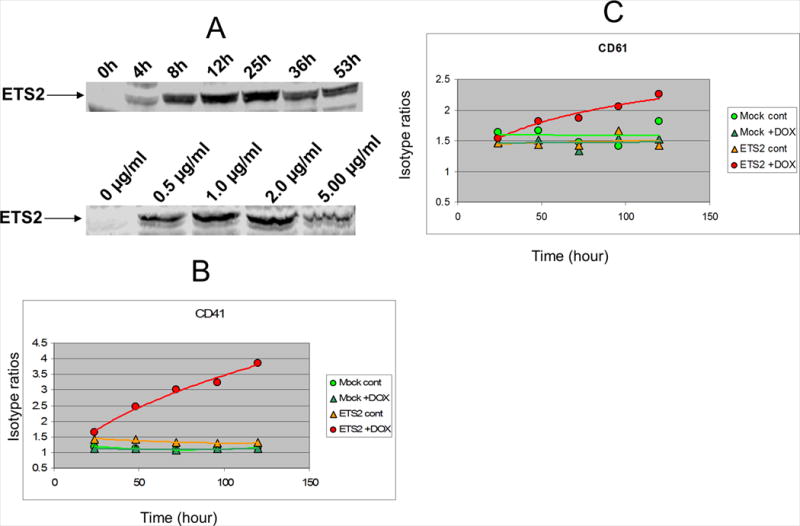
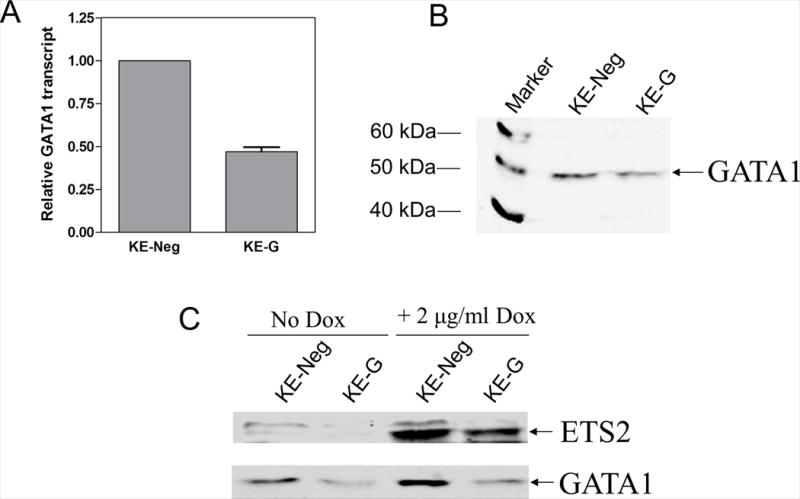
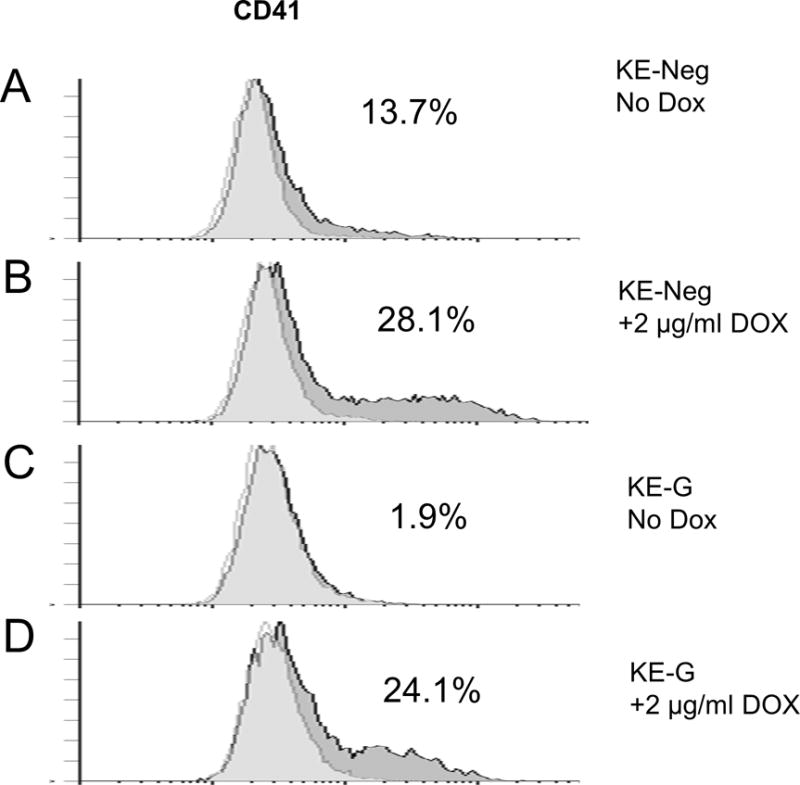
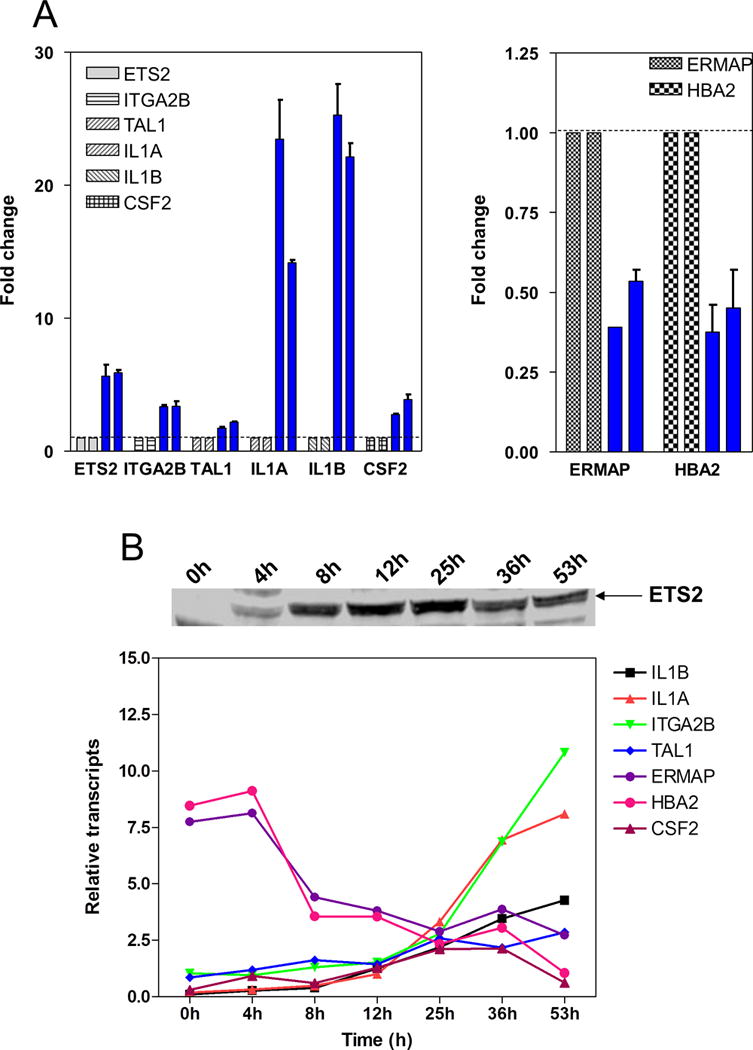
Acute myeloid leukemia (AML) in Down syndrome (DS) children has several unique features including a predominance of the acute megakaryocytic leukemia (AMkL) phenotype, higher event-free survivals compared to non-DS children using cytosine arabinoside (ara-C)/anthracycline-based protocols and a uniform presence of somatic mutations in the X-linked transcription factor gene, GATA1. Several chromosome 21-localized transcription factor oncogenes including ETS2 may contribute to the unique features of DS AMkL. ETS2 transcripts measured by real-time RT-PCR were 1.8- and 4.1-fold, respectively, higher in DS and non-DS megakaryoblasts than those in non-DS myeloblasts. In a doxycycline-inducible erythroleukemia cell line, K562pTet-on/ETS2, induction of ETS2 resulted in an erythroid to megakaryocytic phenotypic switch independent of GATA1 levels. Microarray analysis of doxycycline-induced and doxycycline-uninduced cells revealed an upregulation by ETS2 of cytokines (for example, interleukin 1 and CSF2) and transcription factors (for example, TAL1), which are key regulators of megakaryocytic differentiation. In the K562pTet-on/ETS2 cells, ETS2 induction conferred differences in sensitivities to ara-C and daunorubicin, depending on GATA1 levels. These results suggest that ETS2 expression is linked to the biology of AMkL in both DS and non-DS children, and that ETS2 acts by regulating expression of hematopoietic lineage and transcription factor genes involved in erythropoiesis and megakaryopoiesis, and in chemotherapy sensitivities.


Figures

Figure 1
Figure 1. Overexpression of ETS2 in Down syndrome (DS) and non-DS (NDS) megakaryoblasts compared to NDS AML blasts
Panel A: ETS2 transcript levels in megakaryoblasts, obtained from newly diagnosed DS and NDS children with AMkL, and in myeloblasts from newly diagnosed NDS children with AML, were measured by real time RT-PCR. ETS2 transcript levels were normalized to 18S rRNA levels and are presented as the average values from 2 independent experiments. The horizontal lines indicate median ETS2 transcript levels in each group of patient samples. The p values were determined by the nonparametric Mann Whitney U test. Panel B: ETS2 transcript levels in DS (CMK and CMY) and NDS (Meg-01, CMS and Dami) megakaryocytic leukemia cell lines and NDS AML cell lines (KG1a, K562, U937 and CTS) were measured by real time RT-PCR and normalized to 18S rRNA. The data are presented as average values ± standard errors from 3 independent experiments.
Figure 2
Figure 2. Development of the KE cell line and induction of an erythroid to megakaryocytic phenotypic switch with ETS2 expression
The erythroleukemia cell line, K562, was previously transfected with pTet-on to generate the K562pTet-on stable clone (36). The K562pTet-on stable clone was then transfected with pTRE2hyp-ETS2 by electroporation (200 V, 950 μF) to generate the K562pTet-on/ETS2 stable clone (designated KE). ETS2 protein levels were assayed on Western blots with an anti-ETS2 antibody. The time dependence with 2 μg/ml Dox (panel A, upper panel) and the Dox concentration dependence at 24h (panel A, lower panel) for optimal induction of ETS2 expression in the KE cells were determined. In panels B and C, the KE cells were induced by 2 μg/ml Dox for up to 120 h and subjected to flow cytometry analysis of megakaryocytic cell surface markers (CD41 and CD61, respectively) every 24 h, as described in the Materials and Methods.
Figure 3
Figure 3. siRNA silencing of GATA1 in KE cells
Double strand GATA1 siRNA oligo was cloned into pSliencer 4.1-CMVhygro (Ambion) cut with BamHI and HindIII. The resulting plasmid and a negative control pSilencer 4.1-CMVhygro vector were transfected into the KE cells by electroporation and selected with high dose hygromycin (400 μg/ml) for two weeks. Colonies were isolated in soft agar, expanded in the presence of 400 μg/ml hygromycin, tested for GATA1 expression in the absence of Dox by real-time RT-PCR (panel A) and Western blotting (panel B). One colony was chosen and designated KE-G. A pool of cells from the negative control transfection (designated KE-Neg) was used as the negative control of the GATA1 siRNA stable clone. siRNA knockdown of GATA1 had at the most a minor impact on the inducible expression of ETS2 in the KE-G cells compared to the KE-Neg cells (panel C).
Figure 4
Figure 4. Decreased expression of GATA1 in KE cells did not alter the effects of ETS2 on megakaryocytic differentiation
The KE-Neg and KE-G cells were induced by 2 μg/ml Dox (panels B and D) or vehicle (water) (panels A and C) for 72 h and then subjected to flow cytometry analysis of megakaryocytic cell surface marker, CD41. The percentages on each panel indicate the percentage of CD41 cells.
Figure 5
Figure 5. Validation of microarray results by real time RT-PCR
Several representative genes (ETS2, ITGA2B, TAL1, IL1A, IL1b, CSF2, HBA2 and ERMAP) were selected from the 1683 probes identified in the microarray analysis which were either under or over expressed in the induced KE cells relative to the uninduced cells. Panel A: transcript levels of ETS2, ITGA2B, TAL1, IL1A, IL1B, CSF2, HBA2 and ERMAP in two pairs of RNA samples (same as the microarray samples) from induced (blue bars) and uninduced KE cells were quantitated by real time RT-PCR and normalized to 18S rRNA. Results are presented as the average values ± standard errors from three independent experiments. Transcript levels for the above genes were set as 1 in the uninduced KE cells, as indicated by a dotted line. Panel B: transcript levels of ETS2, ITGA2B, TAL1, IL1A, IL1B, CSF2, HBA2 and ERMAP in the RNA samples from the time course experiment shown in panel A of Figure 2 were quantitated by real time RT-PCR and normalized to 18S rRNA.
Figure 6
Figure 6. In vitro ara-C sensitivities of the KE-Neg (panel A) and KE-G (panel B) cells with or without Dox induction of ETS2
For determinations of cytotoxicities, the cell lines were cultured in complete medium with dialyzed fetal calf serum in 96-well plates at a density of 4 × 10⁴ cells/ml. Cells were cultured continuously with a range of cytosine arabinoside (ara-C) concentrations at 37 °C with or without 2 μg/ml Dox and cell numbers were determined using the Cell Titer-blue reagent (Promega) and a microplate reader. The IC50 values were calculated as the concentrations of drug necessary to inhibit 50% growth compared to control cells cultured in the absence of drug. The data are presented as the mean values ± standard errors from at least 3 independent experiments. By paired T-test, the differences in ara-C IC50s for induced and uninduced cells were statistically significant

References

    1. Taub JW. Relationship of chromosome 21 and acute leukemia in children with Down syndrome. J Pediatr Hematol Oncol. 2001;23:175–178. - PubMed
    1. Zeller B, Gustafsson G, Forestier E, Abrahamsson J, Clausen N, Heldrup J, et al. Acute leukaemia in children with Down syndrome: a population-based Nordic study. Br J Haematol. 2005;128:797–804. - PubMed
    1. Ravindranath Y, Abella E, Krischer JP, Wiley J, Inoue S, Harris M, et al. Acute myeloid leukemia (AML) in Down’s syndrome is highly responsive to chemotherapy: experience on Pediatric Oncology Group AML study 8498. Blood. 1992;80:2210–2214. - PubMed
    1. Ravindranath Y, Yeager AM, Chang MN, Steuber CP, Krischer J, Graham-Pole J, et al. Acute myeloid leukemia in children: a randomized comparative study of purged autologous bone marrow transplantation versus intensive multiagent consolidation chemotherapy in first remission (Pediatric Oncology Group Study-POG 8821) N Engl J Med. 1996;334:1428–1434. - PubMed
    1. Lange BJ, Kobrinsky N, Barnard DR, Arthur DC, Buckley JD, Howells WB, et al. Distinctive demography, biology, and outcome of acute myeloid leukemia and myelodysplastic syndrome in children with Down syndrome: Children’s Cancer Group Studies 2861 and 2891. Blood. 1998;91:608–615. - PubMed

Publication types

MeSH terms