

Adipose gene expression prior to weight loss can differentiate and weakly predict dietary responders
- PMID: 18094752
- PMCID: PMC2147074
- DOI: 10.1371/journal.pone.0001344
Adipose gene expression prior to weight loss can differentiate and weakly predict dietary responders
Abstract
Background: The ability to identify obese individuals who will successfully lose weight in response to dietary intervention will revolutionize disease management. Therefore, we asked whether it is possible to identify subjects who will lose weight during dietary intervention using only a single gene expression snapshot.
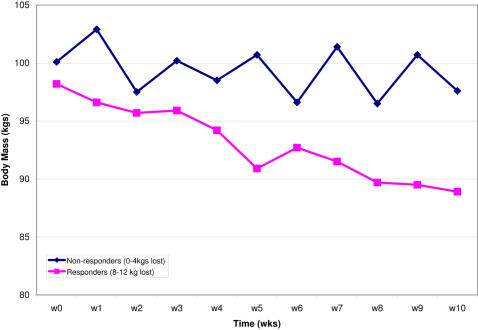
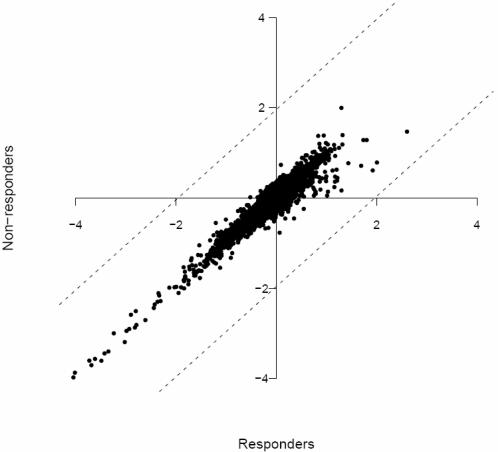
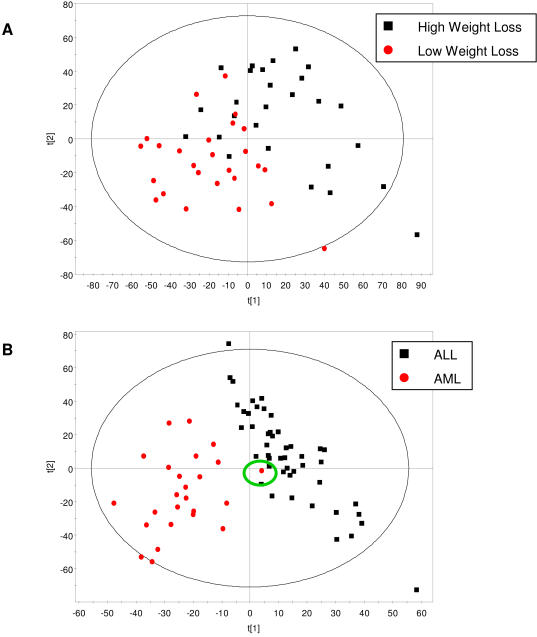
Methodology/principal findings: The present study involved 54 female subjects from the Nutrient-Gene Interactions in Human Obesity-Implications for Dietary Guidelines (NUGENOB) trial to determine whether subcutaneous adipose tissue gene expression could be used to predict weight loss prior to the 10-week consumption of a low-fat hypocaloric diet. Using several statistical tests revealed that the gene expression profiles of responders (8-12 kgs weight loss) could always be differentiated from non-responders (<4 kgs weight loss). We also assessed whether this differentiation was sufficient for prediction. Using a bottom-up (i.e. black-box) approach, standard class prediction algorithms were able to predict dietary responders with up to 61.1%+/-8.1% accuracy. Using a top-down approach (i.e. using differentially expressed genes to build a classifier) improved prediction accuracy to 80.9%+/-2.2%.
Conclusion: Adipose gene expression profiling prior to the consumption of a low-fat diet is able to differentiate responders from non-responders as well as serve as a weak predictor of subjects destined to lose weight. While the degree of prediction accuracy currently achieved with a gene expression snapshot is perhaps insufficient for clinical use, this work reveals that the comprehensive molecular signature of adipose tissue paves the way for the future of personalized nutrition.
Conflict of interest statement
Figures
References
-
- Mutch DM, Wahli W, Williamson G. Nutrigenomics and nutrigenetics: the emerging faces of nutrition. FASEB J. 2005;19:1602–1616. - PubMed
-
- Kaput J, Ordovas JM, Ferguson L, van Ommen B, Rodriguez RL, et al. The case for strategic international alliances to harness nutritional genomics for public and personal health. Br J Nutr. 2005;94:623–632. - PubMed
-
- Jain KK. Challenges of drug discovery for personalized medicine. Curr Opin Mol Ther. 2006;8:487–492. - PubMed
-
- Heidecker B, Hare JM. The use of transcriptomic biomarkers for personalized medicine. Heart Fail Rev. 2007;12:1–11. - PubMed
-
- Golub TR, Slonim DK, Tamayo P, Huard C, Gaasenbeek M, et al. Molecular classification of cancer: class discovery and class prediction by gene expression monitoring. Science. 1999;286:531–537. - PubMed
Publication types
MeSH terms
LinkOut - more resources
Full Text Sources
Other Literature Sources
Medical
