Review
. 2008 Jan;8(1):34-57.
doi: 10.1039/b711887b. Epub 2007 Dec 6.

Biomolecular gradients in cell culture systems

Affiliations
Review

Biomolecular gradients in cell culture systems

Thomas M Keenan et al. Lab Chip. 2008 Jan.

Abstract

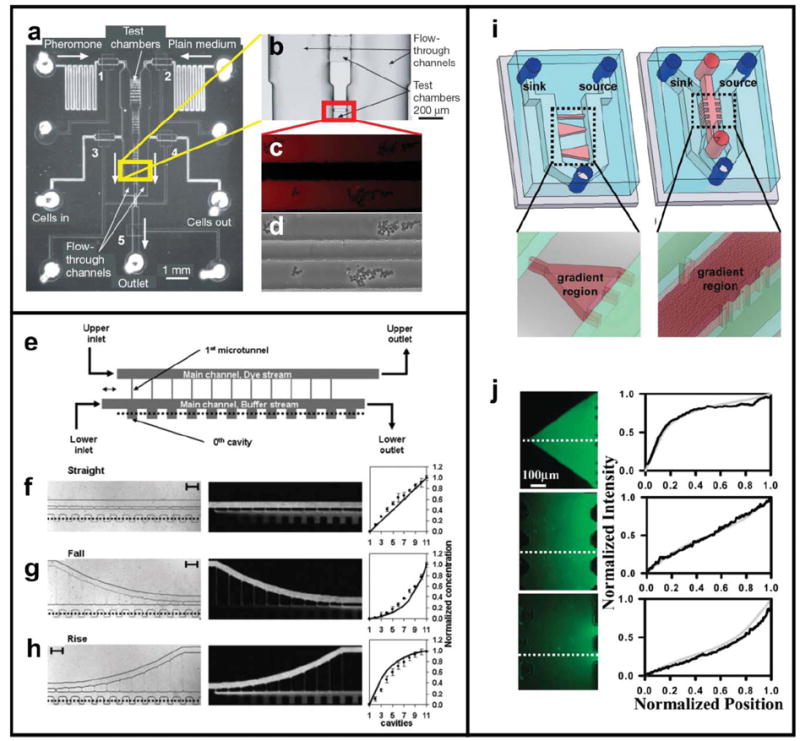
Biomolecule gradients have been shown to play roles in a wide range of biological processes including development, inflammation, wound healing, and cancer metastasis. Elucidation of these phenomena requires the ability to expose cells to biomolecule gradients that are quantifiable, controllable, and mimic those that are present in vivo. Here we review the major biological phenomena in which biomolecule gradients are employed, traditional in vitro gradient-generating methods developed over the past 50 years, and new microfluidic devices for generating gradients. Microfluidic gradient generators offer greater levels of precision, quantitation, and spatiotemporal gradient control than traditional methods, and may greatly enhance our understanding of many biological phenomena. For each method, we outline the salient features, capabilities, and applications.


Figures

Fig. 1
Fig. 1. Biological hydrogels
Gels can be used to expose cells to biomolecule gradients. (a) A neural tissue explant co-cultured with semaphorinexpressing COS cells in a collagen gel (adapted from ref. , copyright Elsevier, 1998). (b) Neutrophils (black dots) are exposed to opposing gradients of Il-8 and leukotriene B4 in an under-agarose assay (reproduced from ref. , copyright 1997 The Rockefeller University Press). (c) The gradient produced in biological hydrogels varies in space and time as shown in this error-function solution of the concentration profiles generated at 5 min intervals for a molecule diffusing away from a constant concentration source using an assumed diffusivity of D = 6.4 × 10⁻⁷ cm2 s−1.
Fig. 2
Fig. 2. Micropipette gradient generation
(a) Electrophysiology micropipettes loaded with soluble signaling molecules are mounted in micromanipulators arranged around the cell culture dish (courtesy of Dr Donglin Bai, University of Western Ontario, London, Ontario). (b) The micropipette is brought within a defined distance to the cell and the biomolecule is pneumatically ejected from the pipette generating a gradient. Here, a Xenopus spinal neuron is turning in response to a netrin-1 gradient (adapted with permission from Macmillan Publishers Ltd: ref. , copyright 2002). (c) The response of the neuron can be quantified by tracing the resulting growth trajectories (adapted with permission from Macmillan Publishers Ltd: ref. , copyright 2002).
Fig. 3
Fig. 3. Transwell Assay
This assay is based on the Boyden Chamber method. Cells seeded on a porous membrane are placed in a well containing a chemoattractant solution. The chemoattractant in the lower compartment diffuses into the upper compartment forming a gradient across the membrane. Cells respond by migrating through the membrane to the bottom surface where they can be subsequently fixed, stained, and counted.
Fig. 4
Fig. 4. Zigmond Chamber
(a) The device consists of two etched channels separated by a glass ridge. The metal tines are used to clamp an inverted glass coverslip seeded with cells to the device (used with permission from Neuroprobe, Inc., Gaithersburg, MD). (b) A cross section schematic of the device shows cells on the inverted coverslip migrating in response to the gradient established between the coverslip and the glass ridge.
Fig. 5
Fig. 5. Dunn Chamber
The Dunn Chamber is similar to the Zigmond Chamber but much less susceptible to evaporation. (a) The device consists of two wells arranged as concentric rings, and separated by a glass bridge (image courtesy of Hawksley Medical and Laboratory Equipment, Lancing, Sussex, UK). (b) A gradient forms in the 20 μm gap between the cell-seeded inverted coverslip and the glass bridge. Cell responses can be directly visualized in the bridge region.
Fig. 6
Fig. 6. Depletion gradient
(a) Microfluidic channels have high surface area to volume ratios that can deplete the concentration of chemicals inside the microchannel if those chemicals bind to internal surfaces. Chemical solutions applied at one end of a microchannel can be used to form adsorbed chemical gradients. (b) Adsorbed depletion gradients of BSA-TRITC (reprinted with permission from ref. , copyright 2003 American Chemical Society). (c) Intensity profiles of each adsorbed gradient shown in (b) (reprinted with permission from ref. , copyright 2003 American Chemical Society).
Fig. 7
Fig. 7. Micropatterned gradients
(a) Schematic of a growth cone navigating a continuous gradient. (b–c) By controlling the spacing and size of printed ephrin A5 (antibody-stained ephrin shown in red) a continuous gradient can be approximated at the cellular level. (d–f) Temporal retinal axons were repelled by the micropatterned gradient in a manner dependent upon the slope (i.e. increasing width) of the ephrin patterns (reproduced from ref. with permission of the Company of Biologists).
Fig. 8
Fig. 8. Nanopore Gradient Generator
(a) Cross-section schematic of the device shows the polyester track etch membranes encapsulated in three layers of PDMS, with the gradient/cell culture chamber composing the bottom layer. (b) Cells loaded into the cell addition port attached to the floor of the sink region and migrated towards the source region in response to a gradient of the bacterial peptide f-met-leu-phe (fMLF) (adapted from ref. , reproduced by permission of The Royal Society of Chemistry).
Fig. 9
Fig. 9. Microvalve Chemotaxis Device (μVCD)
(a) Cross-section schematic of the three-layer device. Cells and gradient fluids reside in the two microchannels in the fluidic layer. The microchannels are kept isolated from each other by a thin membrane sealed to the wall separating the microchannels. When vacuum is pulled in the bottom control layer microchannel, the membrane deflects downwards, fluidically connecting the two microchannels. (b) Top-view image of the device shows a gradient of red dye forming in the presumptive cell culture microchannel upon valve opening. Both microchannels are isolated from convective fluid flow contributions from the inlets by the fluid isolation valves at each end of the microchannels. (c) Phase-contrast micrograph of human neutrophils migrating in response to a gradient of CXCL-8. Colored traces indicate the trajectories of 5 cells (adapted from ref. , reproduced by permission of The Royal Society of Chemistry). (d) Temperature false-colored image corresponding to (c) showing concentration of FITC-dextran along with positions of the 5 cells shown in (c) (adapted from ref. , reproduced by permission of The Royal Society of Chemistry).
Fig. 10
Fig. 10. Microfluidic Multi-Injector (MMI)
(a) A 3D schematic of the device shows a single orifice injector and the valving necessary to create gradients in the presumptive, enclosed cell culture reservoir. (b) Top view of the device creating gradients of FITC-labeled dextran. (c) 3D intensity plot of data acquired in (b) (adapted from ref. , reproduced with permission from the Royal Society of Chemistry).
Fig. 11
Fig. 11. T-sensor based devices
(a) Schematic of the T-sensor with a plot of the concentration profile of a fluorogenic substrate generated by interdiffusion of enzyme (β-gal) and substrate (RBG) solutions (from ref. , copyright 2002 American Chemical Society). (b) T-sensor based diffusion diluter developed by ref. , validated with the fluorescent dye, Alexa 488 (adapted from ref. , copyright Elsevier, 2003). (c) Device used to infect cell populations with a gradient of baculovirus (adapted from ref. , copyright Elsevier, 2004). (d) Device used to study bacterial chemotaxis in the presence of various chemoeffectors (from ref. , copyright 2003 National Academy of Sciences, USA).
Fig. 12
Fig. 12. Premixer Gradient Generator
(a) 2D schematic of the device with 3D exploded view of the gradient generated downstream of the microfluidic mixer. (b) By reconfiguring the upstream mixer a variety of complex gradient profiles can be achieved including linear, hill, and sawtooth (adapted with permission from Macmillan Publishers Ltd: Copyright 2002).
Fig. 13
Fig. 13. “Universal” Gradient Generator
(a) A scanning electron micrograph of the device shows the position of dividers that restrict the orthogonal diffusion of chemical species. (b) Fluorescence images of the concentration distribution of FITC during at various points within the device shown in (a). (c) Intensity profiles of the images in (b) at the regions indicated by the dotted lines (from ref. , copyright 2006 American Chemical Society).
Fig. 14
Fig. 14. Hydrogel-Capped Arbitrary Gradient Generator
(a) 3D schematic of the device shows the 3-layer architecture. (b) Schematic of the device cross section shows a hydrogel slab separating gradient fluid reservoirs from cell culture microfluidic channels. (c) Top-view schematic of the device showing how microchannels of different configurations and a linear gradient between the buffer and solution reservoirs can be used to generate a wide variety of user-defined gradient profiles (d) (reprinted with permission from ref. , copyright 2006 American Chemical Society).
Fig. 15
Fig. 15. Hydrogel Membrane Gradient Generator
(a) 2D schematic of the device showing the features cut into the nitrocellulose membrane with a CO2 laser. (b) Fluorescence micrograph of a fluorescein gradient generated within the center channel of the device. (c) 3D schematic of the device (adapted from ref. by permission of The Royal Society of Chemistry).
Fig. 16
Fig. 16. Microjets Device
(a) 3D schematic of the device showing an open surface gradient created by opposed arrays of small microfluidic channels (i.e. Microjets). (b–d) Top-view confocal fluorescence micrographs and the corresponding 70 kDa dextran surface concentration profiles (solid curves) at equilibrium before and after changes in PL and PR. The dashed white vertical line indicates the position of maximum slope. Yellowdotted lines mark the buried microchannel and cell culture area boundaries. Comparison of b and c show an increase in gradient slope with no effect on gradient position when equal magnitude pressure increases are applied to the Microjets. Comparison of c and d show a shift in gradient position to the right without a change in slope when equal magnitude pressure offsets are applied (a–d reprinted with permission from ref. , copyright 2006 American Institute of Physics). (e) A top-view image of a combination of red, green, and blue dye gradients emanating from Microjets in a T-shaped open cell culture pool.
Fig. 17
Fig. 17. Cross Channel Gradient Generator
(a) Top-view image of the device developed by Paliwal et al. (b) Enlarged photo of the test chamber area shows 5 μm tall test chambers connecting source and sink fluid microchannels. (c) By balancing the hydrostatic pressure delivered to each adjacent microchannel gradients of yeast pheromone could be created in the test chambers (visualized by Alexa 555 dye). (d) S. cerevisiae migrating in response to the pheromone gradient (reprinted from ref. by permission of Macmillan Publishers Ltd). (e) Top-view schematic of the device developed by Li and colleagues uses constantly perfused main channels and cross channels of varying lengths to create linear (f), exponential (g), and logarithmic (h) gradients (reproduced by permission of The Royal Society of Chemistry). (i) Top-view schematic of the device developed by Mosadegh et al. colleagues. (j) By changing the cross sectional dimensions of the cross channels non-linear gradients can be achieved as shown here using fluorescent dyes in Matrigel-filled cross channels (reprinted with permission from ref. , copyright 2007 American Chemical Society).

Similar articles

Cited by

References

    1. Gilbert SF. Developmental Biology. 8. xviii. Sinauer Associates, Inc. Publishers; Sunderland, MA: 2006. p. 817.
    1. Raballo R, et al. Basic fibroblast growth factor (Fgf2) is necessary for cell proliferation and neurogenesis in the developing cerebral cortex. J Neurosci. 2000;20(13):5012–5023. - PMC - PubMed
    1. Ashe HL, Briscoe J. The interpretation of morphogen gradients. Development. 2006;133(3):385–394. - PubMed
    1. Scully KM, Rosenfeld MG. Pituitary development: regulatory codes in mammalian organogenesis. Science. 2002;295(5563):2231–2235. - PubMed
    1. Colamarino SA, Tessier-Lavigne M. The role of the floor plate in axon guidance. Annu Rev Neurosci. 1995;18:497–529. - PubMed

MeSH terms

Substances