. 2008 Jan 15;47(2):826-35.
doi: 10.1021/bi701538e. Epub 2007 Dec 21.

Polymerization properties of the Thermotoga maritima actin MreB: roles of temperature, nucleotides, and ions

Affiliations

Polymerization properties of the Thermotoga maritima actin MreB: roles of temperature, nucleotides, and ions

Greg J Bean et al. Biochemistry. .

Abstract

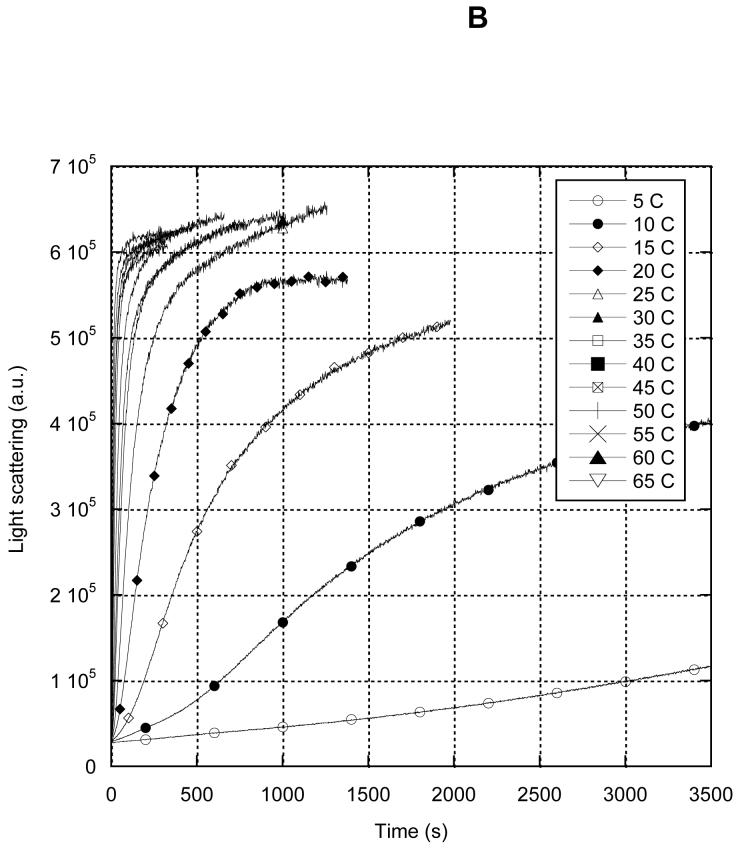
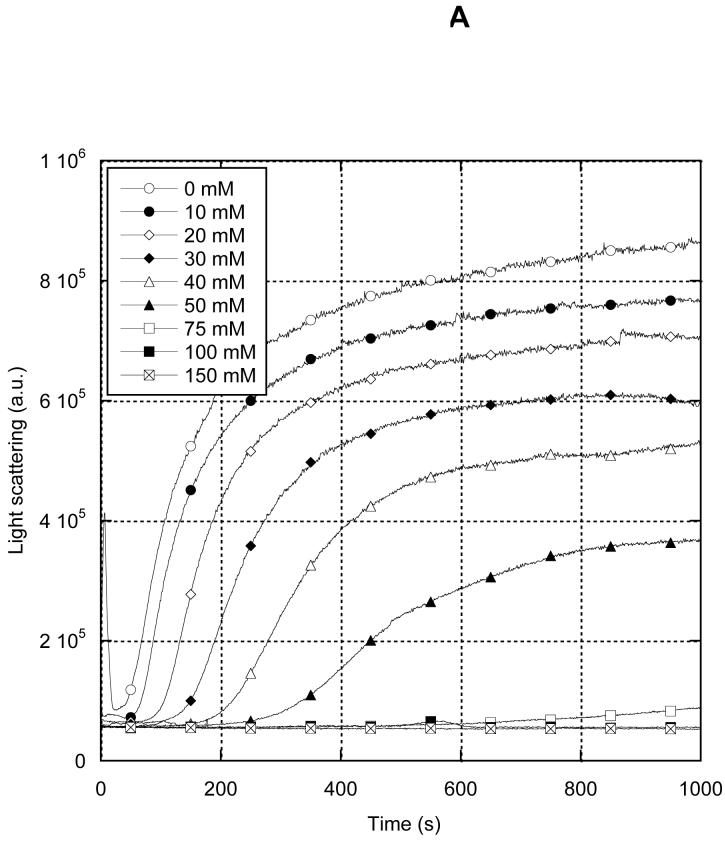
MreB is a bacterial orthologue of actin that affects cell shape, polarity, and chromosome segregation. Although a significant body of work has explored its cellular functions, we know very little about the biochemical behavior of MreB. We have cloned, overexpressed in Escherichia coli, and purified untagged MreB1 from Thermotoga maritima. We have characterized the conditions that regulate its monomer-to-polymer assembly reaction, the critical concentrations of that reaction, the manner in which MreB uses nucleotides, its stability, and the structure of the assembled polymer. MreB requires a bound purine nucleotide for polymerization and rapidly hydrolyzes it following assembly. MreB assembly contains two distinct components, one that does not require divalent cations and one that does, which may comprise the nucleation and elongation phases of assembly, respectively. MreB assembly is strongly favored by increasing temperature or protein concentration but inhibited differentially by high concentrations of monovalent salts. The polymerization rate increases and the bulk critical concentration decreases with increasing temperature, but in contrast to previous reports, MreB is capable of polymerizing across a broad range of temperatures. MreB polymers are shorter and stiffer and scatter more light than eukaryotic actin filaments. Due to rapid ATP hydrolysis and phosphate release, we suggest that most assembled MreB in cells is in the ADP-bound state. Because of only moderate differences between the ATP and ADP critical concentrations, treadmilling may occur, but we do not predict dynamic instability in cells. Because of the relatively low cellular concentration of MreB and the observed structural properties of the polymer, a single MreB assembly may exist in cells.


Figures

Fig. 1
Fig. 1
Sedimentation of MreB. 4 μM MreB was incubated in CaG8 buffer (2 mM Tris-HCl pH 8.0, 0.1 mM CaCl2, 200 μM ATP, 0.5 mM DTT, 0.02% NaN3) with or without 1x KMEI (10mM imidazole, pH 7.0, 1mM MgCl2, 1 mM EGTA and 20 mM KCl) for either 1 h at 20 °C or overnight at 4 °C. Equivalent volumes of total (T) and 100k × g supernatants (S) and pellets (P) are shown by SDS-PAGE and Coomassie Blue.
Fig. 2
Fig. 2
Concentration-dependent polymerization of MreB. MreB in Ca-storage buffer was converted to Mg and polymerization was subsequently induced at 20 °C by dilution into buffer containing 10mM imidazole, pH 7.0, 1mM MgCl2, 1 mM EGTA, 20 mM KCl and 200uM ATP. Polymerization timecourse was monitored by 90 ° light scattering at 400 nm. [MreB]: 1 μM (open circles), 2 μM (closed circles), 3 μM (open diamonds), 4 μM (closed diamonds), 5 μM (open triangles), 6 μM (closed triangles), 8 μM (open squares), 10 μM (closed squares), 12 μM (open inverted triangles).
Fig. 3
Fig. 3
pH dependence of MreB polymerization. 8 μM MreB was polymerized at 20 °C in 0.1 mM EGTA, 1 mM MgCl2, 20 mM KCl, 200 μM ATP and 10 mM MES pH 5.5 (open circles), MES pH 6.0 (closed circles), imidazole pH 6.5 (open diamonds), imidazole pH 7.0 (closed diamonds), Tris pH 7.5 (open triangles), Tris pH 8.0 (closed triangles), Tris pH 8.5 (open squares), Tris pH 9.0 (closed squares) or Tris pH 9.5 (open inverted triangles). Polymerization timecourse was followed by 400 nM light scattering.
Fig. 4
Fig. 4
Divalent cation dependence of MreB polymerization. 8 μM MreB was polymerized at 20 °C in 10 mM imidazole pH 8.0 and 200 μM ATP containing CaCl2 at 0.1 (open circles), 0.2 (closed circles), 0.3 (open diamonds), 0.4 (closed diamonds), 0.5 (open triangles), 0.7 (closed triangles), 1.0 (open squares), 1.3 (closed squares), 1.6 (open inverted triangles), or 2 (closed inverted triangles) mM. Polymerization timecourse was followed by 400 nM light scattering.
Fig. 5
Fig. 5
MreB polymerization measured by light scattering and fluorescence resonance energy transfer. MreB. Parallel polymerization experiments were carried out in 10mM imidazole, pH 7.0, 1mM MgCl2, 1 mM EGTA, 20 mM KCl and 200uM ATP, using 82% wild-type, unlabeled MreB doped with 3% Alexa488 L322C and 15% Alexa555 L322C MreB. Polymerization timecourse was followed by either 400 nm light scattering or by FRET intensity. 5 μM light scattering (open circles), 5 μM FRET (closed circles), 10 μM light scattering (open triangles), 10 μM FRET (closed triangles), 15 μM light scattering (open squares), 15 μM FRET (closed squares).
Fig. 6
Fig. 6
Temperature-dependence of MreB polymerization. 8 μM MreB was polymerized in 10mM imidazole, pH 7.0, 1mM MgCl2, 1 mM EGTA, 20 mM KCl and 200uM ATP at different temperatures. Polymerization timecourse was followed by 400 nM light scattering. A, first 120 s of reactions. B, full 3500 s of reactions. 5 °C (open circles), 10 °C (closed circles), 15 °C (open diamonds), 20 °C (closed diamonds), 25 °C (open triangles), 30 °C (closed triangles), 35 °C (open squares), 40 °C (closed squares), 45 °C (crossed squares), 50 °C (+), 55 °C (X), 60 °C (closed triangles), 65 °C (open inverted triangles).
Fig. 6
Fig. 6
Temperature-dependence of MreB polymerization. 8 μM MreB was polymerized in 10mM imidazole, pH 7.0, 1mM MgCl2, 1 mM EGTA, 20 mM KCl and 200uM ATP at different temperatures. Polymerization timecourse was followed by 400 nM light scattering. A, first 120 s of reactions. B, full 3500 s of reactions. 5 °C (open circles), 10 °C (closed circles), 15 °C (open diamonds), 20 °C (closed diamonds), 25 °C (open triangles), 30 °C (closed triangles), 35 °C (open squares), 40 °C (closed squares), 45 °C (crossed squares), 50 °C (+), 55 °C (X), 60 °C (closed triangles), 65 °C (open inverted triangles).
Fig. 7
Fig. 7
Thermal stability of MreB. Thermal denaturation of 2.2μM MreB was measured by circular dichroism at 222 nm. Temperature was increased in 5 °C steps with 5 min equibration. Buffer conditions: 100 mM Tris-HCl pH 7.0, 100 mM NaCl (squares) or 2 mM Tris-HCl, pH 8.0, 100 μM CaCl2, 3 μM ATP (triangles). Melting temperatures are 53 °C and 70 °C, respectively.
Fig. 8
Fig. 8
Salt-sensitivity of MreB polymerization. 8 μM MreB was polymerized in 10 mM imidazole, pH 7.0, 200 μM ATP, varying concentrations of KCl, and 1 mM CaCl2 (A) or MgCl2 (B). 0 mM KCl (open circles), 10 mM (closed circles), 20 mM (open diamonds), 30 mM (closed diamonds), 40 mM (open triangles), 50 mM (closed triangles), 75 mM (open squares), 100 mM (closed squares), 150 mM (crossed squares). 200 mM (+).
Fig. 8
Fig. 8
Salt-sensitivity of MreB polymerization. 8 μM MreB was polymerized in 10 mM imidazole, pH 7.0, 200 μM ATP, varying concentrations of KCl, and 1 mM CaCl2 (A) or MgCl2 (B). 0 mM KCl (open circles), 10 mM (closed circles), 20 mM (open diamonds), 30 mM (closed diamonds), 40 mM (open triangles), 50 mM (closed triangles), 75 mM (open squares), 100 mM (closed squares), 150 mM (crossed squares). 200 mM (+).
Fig. 9
Fig. 9
Phosphate release by MreB. MreB was polymerized in 10 mM imidazole, pH 7.0, 1 mM MgCl2, 20 mM KCl, 200 μM ATP at 20 °C. Polymerization timecourse (open symbols) was determined by 400 nm light scattering. Phosphate production (closed symbols) was determined in parallel experiments using the colorimetric Enz-chek assay. MreB concentration: 6 μM (circles) or 12 μM (triangles). Error bars represent standard deviation of n=3.
Fig. 10
Fig. 10
Nucleotide release by MreB. Dissociation of RATP from Mg-MreB in the presence of 1 μM ATP was followed by excitation at 360 nm and emission at 410 nm. Fitting the normalized 410 nm fluorescence intensity to a single exponential curve-fit gave a k of 0.036 s-1 and T1/2 of 19 s.
Fig. 11
Fig. 11
Bulk critical concentration determination of MreB. MreB was polymerized overnight in A, 10mM imidazole, pH 7.0, 1mM MgCl2, 1 mM EGTA, 20 mM KCl and 200uM ATP or B, 2mM Tris pH 8.0, 0.1mM CaCl2, 200μM ATP and 0.5 mM DTT at 4 °C. Samples were equilibrated to 20 °C for 1 hr and light scattering intensity was measured. Linear fits to the data yield a critical concentration of 500 nM (A) and 1280 nM (B), respectively.
Fig. 11
Fig. 11
Bulk critical concentration determination of MreB. MreB was polymerized overnight in A, 10mM imidazole, pH 7.0, 1mM MgCl2, 1 mM EGTA, 20 mM KCl and 200uM ATP or B, 2mM Tris pH 8.0, 0.1mM CaCl2, 200μM ATP and 0.5 mM DTT at 4 °C. Samples were equilibrated to 20 °C for 1 hr and light scattering intensity was measured. Linear fits to the data yield a critical concentration of 500 nM (A) and 1280 nM (B), respectively.
Fig. 12
Fig. 12
Light scattering intensity of MreB and muscle actin filaments. MreB or rabbit skeletal muscle actin was polymerized at 20 °C in (MreB) 10mM imidazole, pH 7.0, 1mM MgCl2, 1 mM EGTA, 20 mM KCl and 200uM ATP or (actin) 10mM imidazole, pH 7.0, 1mM MgCl2, 1 mM EGTA, 50 mM KCl and 200uM ATP at different concentrations. Polymerization was followed by light scattering. Note logarithmic y-axis. Actin (open symbols) or MreB (closed symbols) at 2 μM (circles), 6 μM (triangles) and 12 μM (squares).
Fig. 13
Fig. 13
Epifluorescence microscopy of MreB polymers. A, 1 μM MreB (40% Alexa555-labeled) was polymerized in 10mM imidazole, pH 7.0, 1mM MgCl2, 1 mM EGTA, 20 mM KCl and 200uM ATP for 1 h and imaged directly without dilution by epifluorescence microscopy. Scale bar = 10 μm. B, histogram of poymer lengths. 3.4 +/- 1.6 mm (mean +/- std. dev.) (n=100).
Fig. 13
Fig. 13
Epifluorescence microscopy of MreB polymers. A, 1 μM MreB (40% Alexa555-labeled) was polymerized in 10mM imidazole, pH 7.0, 1mM MgCl2, 1 mM EGTA, 20 mM KCl and 200uM ATP for 1 h and imaged directly without dilution by epifluorescence microscopy. Scale bar = 10 μm. B, histogram of poymer lengths. 3.4 +/- 1.6 mm (mean +/- std. dev.) (n=100).

References

    1. Alberts B, Bray D, Lewis J, Raff M, Roberts K, Watson J. Molecular Biology of the Cell - Second Edition. Garland; New York: 1989.
    1. Fitch W. Distinguishing homologous from analogous proteins. Systematic Zoology. 1970;19:99–113. - PubMed
    1. Koonin EV. Orthologs, Paralogs, and Evolutionary Genomics. Annual Review of Genetics. 2005;39:309–338. - PubMed
    1. Mukherjee A, Dai K, Lutkenhaus J. Escherichia coli Cell Division Protein FtsZ is a Guanine Nucleotide Binding Protein. PNAS. 1993;90:1053–1057. - PMC - PubMed
    1. Jones LJF, Carballido-Lopez R, Errington J. Control of Cell Shape in Bacteria: Helical, Actin-like Filaments in Bacillus subtilis. Cell. 2001;104:913–922. - PubMed

Publication types

MeSH terms