. 2008 Jan 1;121(Pt 1):29-37.
doi: 10.1242/jcs.022681.

Phosphorylation of vascular endothelial cadherin controls lymphocyte emigration

Affiliations

Phosphorylation of vascular endothelial cadherin controls lymphocyte emigration

Patric Turowski et al. J Cell Sci. .

Abstract

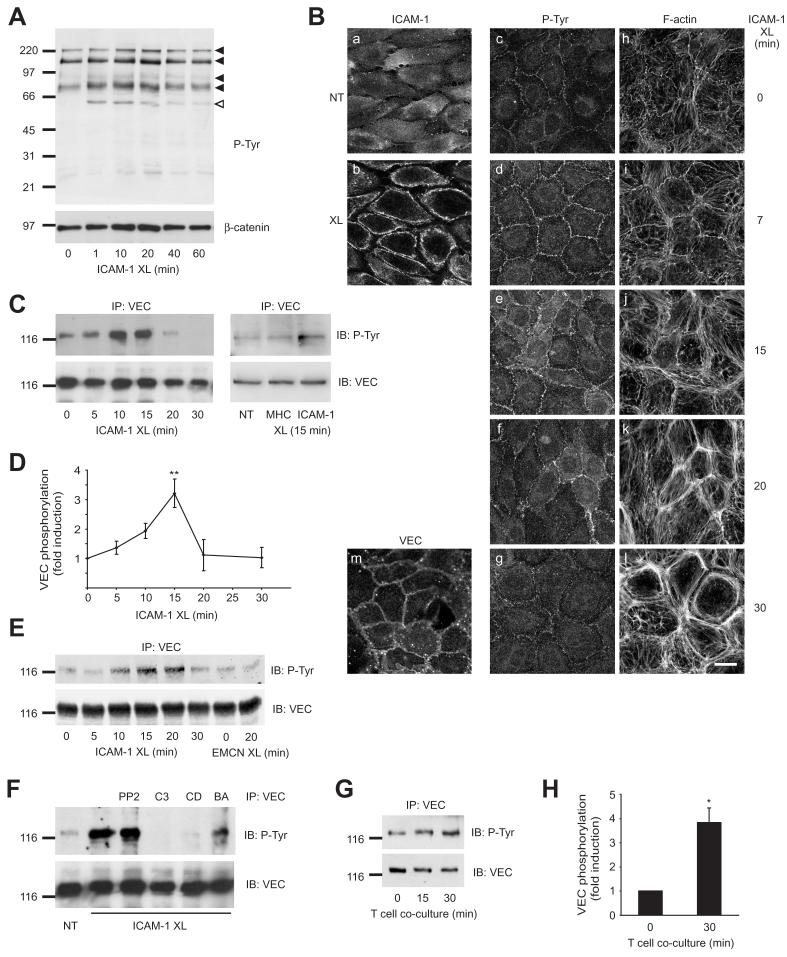
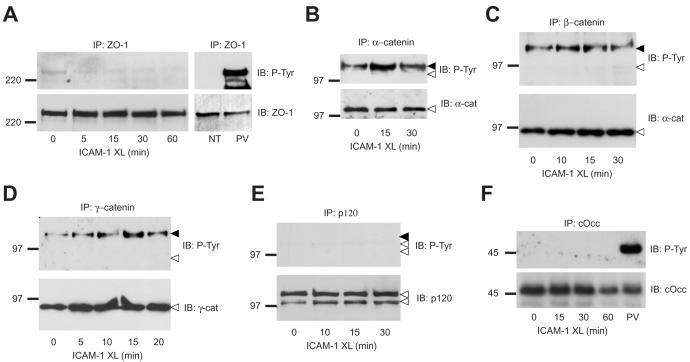
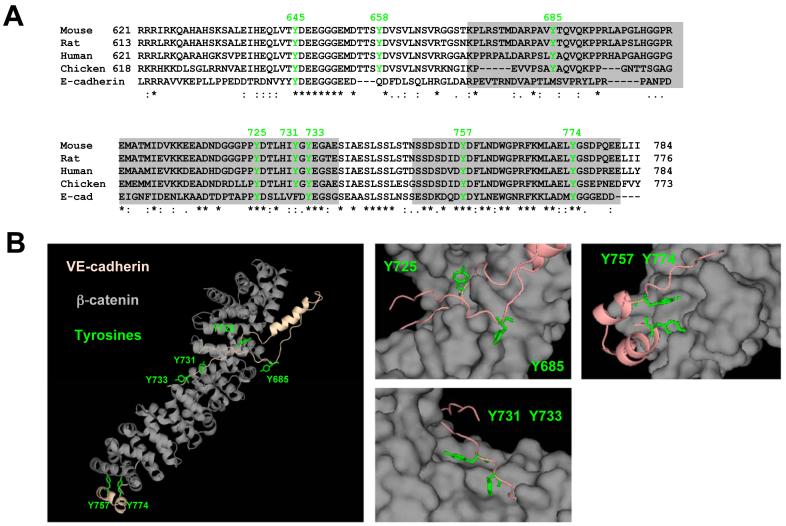
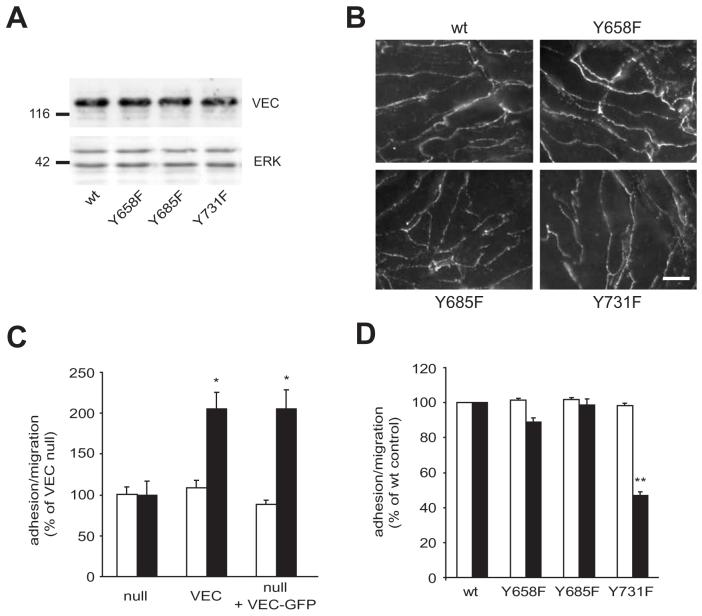
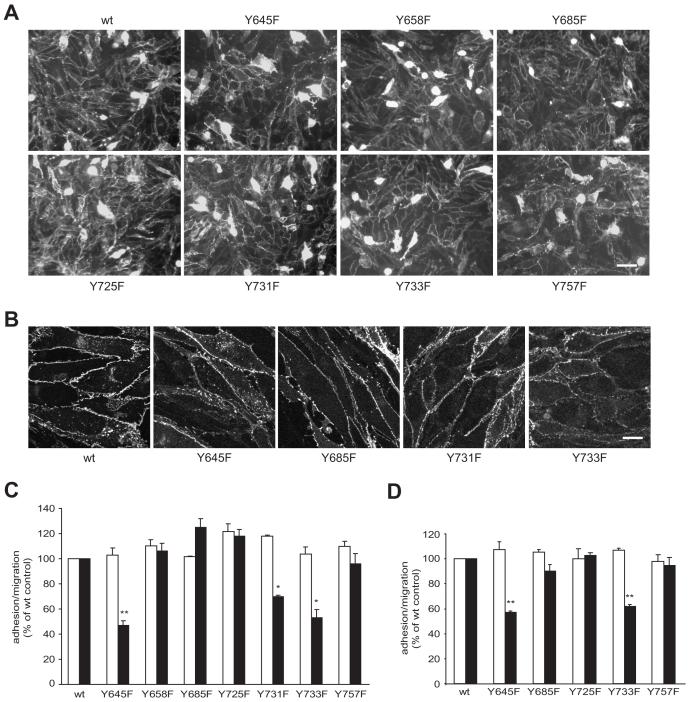
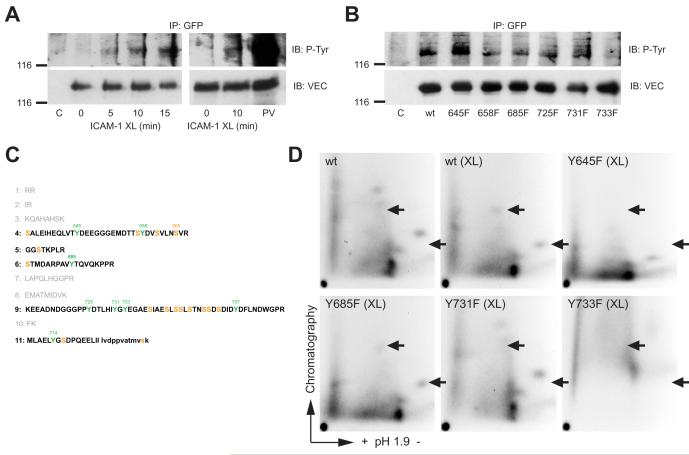
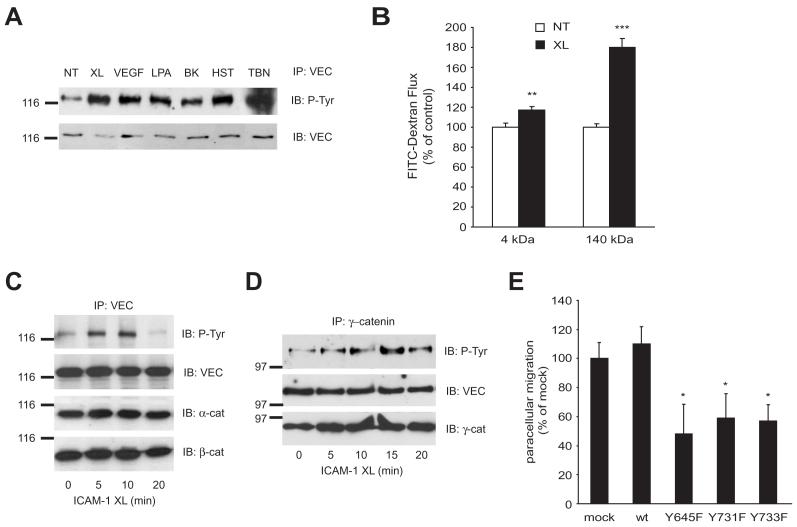
Lymphocytes emigrate from the circulation to target tissues through the microvascular endothelial cell (EC) barrier. During paracellular transmigration cell-cell junctions have been proposed to disengage and provide homophilic and heterophilic interaction surfaces in a zip-like process. However, it is not known whether ECs modulate junction proteins during this process. Here we show that tyrosine phosphorylation of adherens junction vascular endothelial cadherin (VEC) is required for successful transendothelial lymphocyte migration. We found that adhesion of lymphocytes or activation of the endothelial intercellular adhesion molecule 1 (ICAM1) led to tyrosine phosphorylation of VEC. Substitution of tyrosine for phenylalanine in VEC at positions 645, 731 or 733 produced ECs that were significantly less permissive to lymphocyte migration. We also found that these same tyrosine residues are involved in ICAM1-dependent changes of VEC phosphorylation. ICAM1 activation enhanced transendothelial permeability, suggesting the occurrence of junction disassembly. In agreement, the expression of VEC mutated at Y645F, Y731F or Y733F predominantly affected lymphocyte transmigration in paracellular areas. Taken together, these results demonstrate that phosphorylation of adherens junctions constitutes a molecular endpoint of lymphocyte-induced vascular EC signaling and may be exploited as a new target of anti-inflammatory therapies.


Figures

Fig. 1
Fig. 1
Tyrosine phosphorylation of VEC following ICAM-1 cross-linking or adhesion of lymphocytes. (A) GPNT brain microvascular ECs were grown to confluence, serum starved and ICAM-1 crosslinked (XL) for the indicated times. Total protein extracts (ca. 50 μg) were analyzed by immunoblotting with anti-phospho-tyrosine antibodies. Blots were subsequently stripped and probed for β-catenin as loading control. Four proteins with apparent molecular masses of 220, 140, 94 and 83 kDa (previously identified as cortactin (Durieu-Trautmann et al., 1994)) displayed clearly enhanced tyrosine phosphorylation and are indicated by filled arrowheads. Open arrowheads indicate the position of the IgG heavy chains of the crosslinking antibody. (B) Confluent GPNT brain microvascular ECs were serum starved and either left untreated (a, m) or ICAM-1 cross-linked for 15 minutes (b) or the indicated times (c-l). Cells were fixed, extracted and stained for surface ICAM-1 (a, b), phospho-tyrosine (c-g), F-actin (h-l) or VEC (m). Bar, 10 μm. (C-F) Confluent GPNT cells (C, D, F) or mouse brain endothelioma EC, bEND5 (E), were serum starved and subjected to crosslinking of ICAM-1 (XL) or unrelated surface molecules (MHC class I, EMCN: endomucin). At the indicated times cells were washed and lysed. VEC immunoprecipitates were then analysed by immunoblotting using either anti-phospho-tyrosine or –VEC antibodies. (D) The amount of tyrosine-phosphorylated VEC (in panel C) was quantified by densitometry from five independent experiments and expressed as fold-increase of untreated controls (means ± SEM). (F) Prior to ICAM-1 crosslinking (15 minutes) and where indicated, cells were pre-treated using PP2 (10 μM, 30 minutes), C3 transferase (2 μg/mL, 16 hours), cytochalasin D (CD, 2 μM, 30 minutes) or BAPTAM (BA, 20 μM, 30 minutes). (G, H) Confluent GPNT were co-cultured with 2 × 10⁶ /ml rat peripheral lymph node (PLN) lymphocytes (ca. 5 lymphocytes per EC). At the indicated times cells were lysed and VEC immunoprecipitates prepared and analysed as described above. (H) Data from four independent experiments were quantified by densitometry, normalized and expressed as fold-increase of untreated controls (means ± SEM). Significant differences were determined by Student’s t test, * p<0.003, ** p<0.002. In all blots the position of size markers (in kDa) is indicated on the left.
Fig. 2
Fig. 2
Analysis of tyrosine phosphorylation of other junction proteins in ICAM-1 stimulated ECs. (A-E) Confluent GPNT cells were serum starved and ICAM-1 crosslinked (XL). At the indicated times cells were washed, lysed and subjected to immunoprecipitation of ZO-1 (A) and catenins as indicated (B-E). Immunoprecipitates were then analysed by immunoblotting using either anti-phospho-tyrosine, –ZO-1, -VEC or -catenin antibodies. Black and white arrowheads in panels A-E indicate the position of migration of VEC and relevant catenins, respectively, as determined by stripping and re-probing of the immunoblots. P120 immunoprecipitates did not contain detectable VEC, whether phosphorylated (black arrowhead) or not (data not shown). (F) The chicken occludin-expressing GPNT cell line (see Supplemental Fig. S1) was grown to confluence, serum starved and ICAM-1 crosslinked (XL). At the indicated times chicken occludin was immunoprecipitated and analysed by immunoblotting for phospho-tyrosine or occludin. In all blots the position of size markers (in kDa) is indicated on the left.
Fig. 3
Fig. 3
Conserved tyrosines in the cytoplasmic domain of VEC. (A) Sequence alignment of cytoplasmic domains of VEC and mouse E-cadherin. Tyrosines conserved in VEC and their relative position (mouse/human) are indicated in green. Identical residues, conserved and semi-conserved substitutions are indicated by asterisks, colons and dots, respectively. Grey boxes denote areas corresponding to those parts of E-cadherin which interact with β-catenin in co-crystals (Huber and Weis, 2001). (B) Mouse VEC was computer-modeled on the crystal structure of mouse E-cadherin in the E-cadherin-β-catenin complex (i.e. boxed in panel A) (pdb: 1i7x, 1i7w). Shown in the left panel is a ribbon representation of this model with the position and orientation of six tyrosines highlighted in green. The right panels represent enlarged views of areas surrounding these tyrosines. The β-catenin chain is in a space filling representation. Significantly, in this model Y685, the residue predominantly phosphorylated following VEGF stimulation (Wallez et al., 2006), is not accessible when β-catenin is bound.
Fig. 4
Fig. 4
Y731 within the intracellular domain of VEC is important for lymphocyte migration. Mouse endothelioma cell lines, null for VEC and stably re-expressing wt or Y to F mutants of VEC were grown to confluence. (A) Equal amounts of proteins were analysed by immunoblotting using anti-VEC and anti-ERK antibodies. The position of size markers (in kDa) is indicated on the left. (B) Immunocytochemical analysis of the VEC distribution. Bar, 10 μm. (C) Mouse endothelioma cell lines, null for VEC, stably re-expressing wt VEC or transiently nucleofected with VEC-GFP were grown to confluence. They were then incubated with antigen-specific T cells, which were allowed to adhere and migrate for 4 hours. Adhesion (white) and migration (black) across these EC populations was then determined as described in the Methods section. Results are expressed as % increase of VEC-null EC (mean ± SEM of six replicates from five independent experiments). (D) Lymphocyte migration across the indicated, stable mouse endothelioma cell lines. Adhesion (white) and migration (black) across individual transfected EC populations was then measured as above. Results are expressed as % of control cells re-expressing wt VEC (mean ± SEM of six replicates from at least three independent experiments). Significant differences were determined by Student’s t test, * p<0.005, ** p<0.0001.
Fig. 5
Fig. 5
Y to F substitutions in the intracellular domain of VEC at positions 645, 731 or 733 affect lymphocyte migration in a dominant manner. GPNT brain microvascular EC were nucleofected with wt or Y to F mutants of pEGFP-N’-VEC. On average 80 % of cells expressed VEC-EGFP over a period of up to three to four days. (A) Shown here transfected GPNT cells that were fixed after 2 days and VEC-GFP distribution analyzed by fluorescent microscopy. Bar, 50 μm. (B) Three days after transfection, GPNT cells were fixed and VEC-GFP expression analysed by confocal microscopy. Bar, 10 μm. (C) Nulceofected GPNT were grown to confluence for 24-48 hours at which point equal expression was verified by fluorescent microscopy (see panel A). Lymphocyte adhesion (white) and migration (black) was then measured as described in Fig. 4. (D) Mouse VEC-null endothelioma cells (see Fig. 4) were nucleofected with wt or the indicated Y to F mutants of pEGFP-N’-VEC before T cell adhesion and migration was assessed. Significant differences were determined by Student’s t test, * p<0.005; ** p<0.0001.
Fig. 6
Fig. 6
ICAM-1 induced VEC phosphorylation in wt and mutant VEC. (A) CHO-ICAM-1 cells were transfected with wt pEGFP-N’-VEC or not, grown to post-confluence and then starved. Cells were then subjected to ICAM-1 crosslinking and VEC-GFP immunoprecipitated and analysed by immunoblotting for phospho-tyrosine and VEC. C: untransfected controls, PV: sample from pervandate (100 μM) pretreated cells. (B) As described for panel A, except that the CHO-ICAM-1 cells were transfected with wt or Y to F mutants of VEC as indicated. ICAM-1 crosslinking was 10 minutes. (C) The sequence of the cytoplasmic domain of mouse VEC as shown in Fig. 3 A has been used to predict tryptic peptides. Amino acids in small letters in peptide 11 are from the linker sequence to EGFP (which is not shown). Five out of the eleven peptides (shown in bold) contain many phosphorylatable serine and tyrosine residues in line with our observation that VEC is strongly phosphorylated on serine and less so on tyrosine (data not shown). Note: in contrast to the report by Wallez et al. (2006) we have assumed that trypsin digestion does not occur when a proline is found at the carboxylic side of lysine or arginine. (D) CHO-ICAM-1 cells were transfected with pEGFP-N’-VEC as described above. Cells were labeled with 32P and then subjected to ICAM-1 crosslinking or not. VEC-GFP was immunoprecipitated and processed for tryptic peptide mapping. Arrowheads denote the position of crosslinking-specific phosphopeptides. The three maps displayed in a single row were chromatographed in the same tank and Rf values were directly comparable. Enlarged sections of the phospho-peptide maps showing ICAM-1 crosslinking specific phospho-peptides are shown in Supplemental Fig. S2.
Fig. 7
Fig. 7
ICAM-1 mediated VEC phosphorylation affects paracellular migration and coincides with increased EC permeability. (A) GPNT brain microvascular ECs were grown to confluence, serum starved and then either left untreated (NT) or subjected to ICAM-1 crosslinking (XL), 50 ng/mL VEGF, 10 mM lysophosphatidic acid (LPA), 10 μM bradykinin (BK), 100 μM histamine (HST) or 1U/mL thrombin (TBN) for 15 minutes. Subsequently, cells were lysed and VEC immunoprecipitates analysed by immunoblots using anti-phospho-tyrosine or –VEC antibodies. (B) The flux of 4 or 140 kDa FITC-dextran across confluent GPNT monolayers was measured when ICAM-1 was crosslinked (XL) or not (NT). In each case, the FITC-dextran flux was linear over 120 minutes. The values shown are mean permeability changes that occurred over the initial linear 50-minute period following crosslinking in three independent experiments. (C, D) Confluent GPNT EC were serum starved and ICAM-1 crosslinked (XL). At the indicated times cells were lysed and subjected to immunoprecipitation of VEC (C) or γ-catenin (D). Immunoprecipitates were then analysed by immunoblotting using antibodies against phospho-tyrosine, α-, β-, γ-catenins or VEC. Similar results were achieved when the order of the proteins for immunoprecipitates and immunoblots was inverted (Fig. 2 and data not shown). In all blots the position of size markers (in kDa) is indicated on the left. (E) GPNT brain microvascular EC were nucleofected with wt or Y to F mutants of pEGFP-N’-VEC as described in Figure 3. They were then incubated with antigen-specific T cells, which were allowed to adhere and migrate for 1-4 h. Subsequently time-lapsed microscopy was performed over a 5 to 10 minutes to determine the fraction of T cells migrating in the paracellular area of the EC. Results are the mean ± SEM of six replicates from at least three independent experiments. Significant differences were determined by Student’s t test, * p<0.05, ** p=0.005, *** p<0.0001.

References

    1. Adamson P, Etienne S, Couraud PO, Calder V, Greenwood J. Lymphocyte migration through brain endothelial cell monolayers involves signaling through endothelial ICAM-1 via a rho-dependent pathway. J. Immunol. 1999;162:2964–2973. - PubMed
    1. Allingham MJ, van Buul JD, Burridge K. ICAM-1-Mediated, Src- and Pyk2-Dependent Vascular Endothelial Cadherin Tyrosine Phosphorylation Is Required for Leukocyte Transendothelial Migration. J. Immunol. 2007;179:4053–4064. - PubMed
    1. Andriopoulou P, Navarro P, Zanetti A, Lampugnani MG, Dejana E. Histamine induces tyrosine phosphorylation of endothelial cell-to-cell adherens junctions. Arterioscler. Thromb. Vasc. Biol. 1999;19:2286–2297. - PubMed
    1. Bazzoni G, Dejana E. Endothelial cell-to-cell junctions: molecular organization and role in vascular homeostasis. Physiol Rev. 2004;84:869–901. - PubMed
    1. Boyle WJ, van der GP, Hunter T. Phosphopeptide mapping and phosphoamino acid analysis by two-dimensional separation on thin-layer cellulose plates. Methods Enzymol. 1991;201:110–149. - PubMed

Publication types

MeSH terms