. 2008 Mar;196(4):591-602.
doi: 10.1007/s00213-007-0994-6. Epub 2007 Dec 21.

A novel method for automatic quantification of psychostimulant-evoked route-tracing stereotypy: application to Mus musculus

Affiliations

A novel method for automatic quantification of psychostimulant-evoked route-tracing stereotypy: application to Mus musculus

Stephen J Bonasera et al. Psychopharmacology (Berl). 2008 Mar.

Abstract

Rationale: Route-tracing stereotypy is a powerful behavioral correlate of striatal function that is difficult to quantify. Measurements of route-tracing stereotypy in an automated, high throughput, easily quantified, and replicable manner would facilitate functional studies of this central nervous system region.

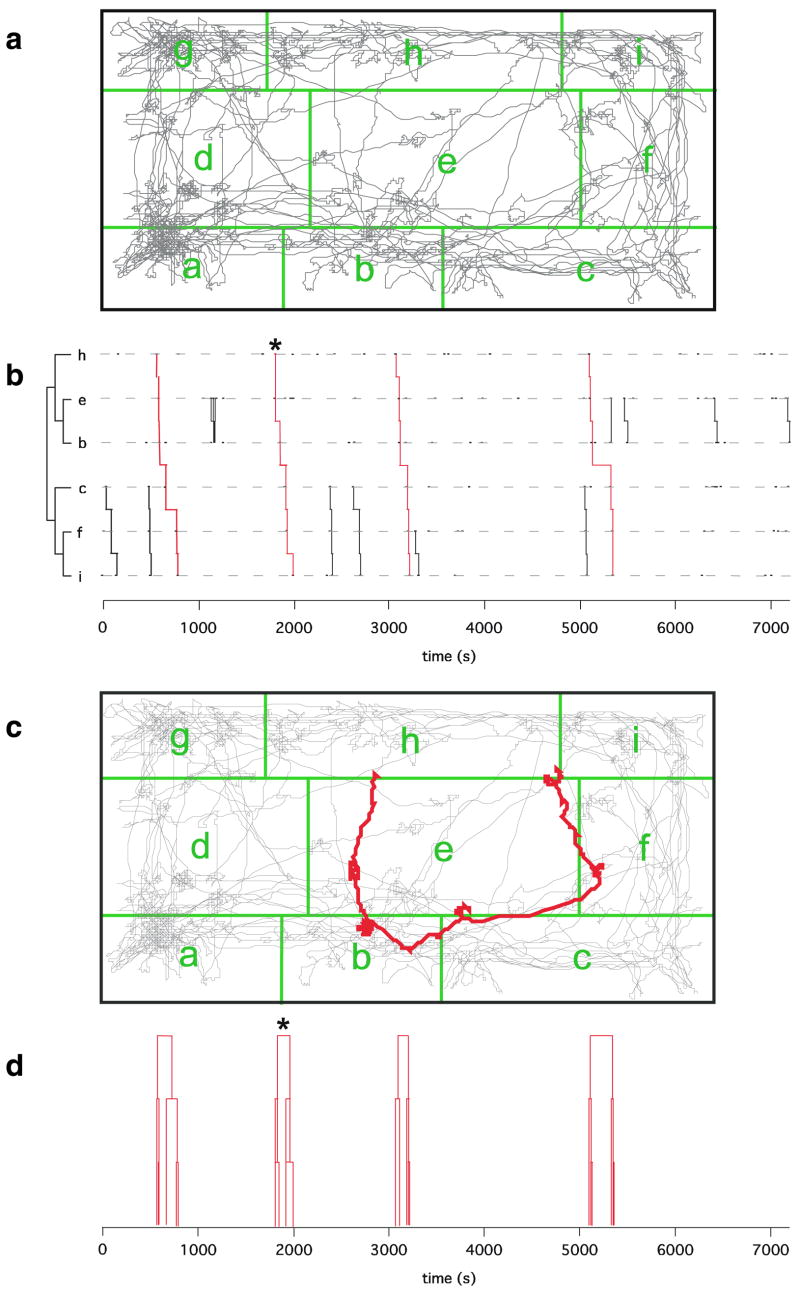
Objective: We examined how t-pattern sequential analysis (Magnusson Behav Res Meth Instrum Comput 32:93-110, 2000) can be used to quantify mouse route-tracing stereotypies. This method reveals patterns by testing whether particular sequences of defined states occur within a specific time interval at a probability greater than chance.

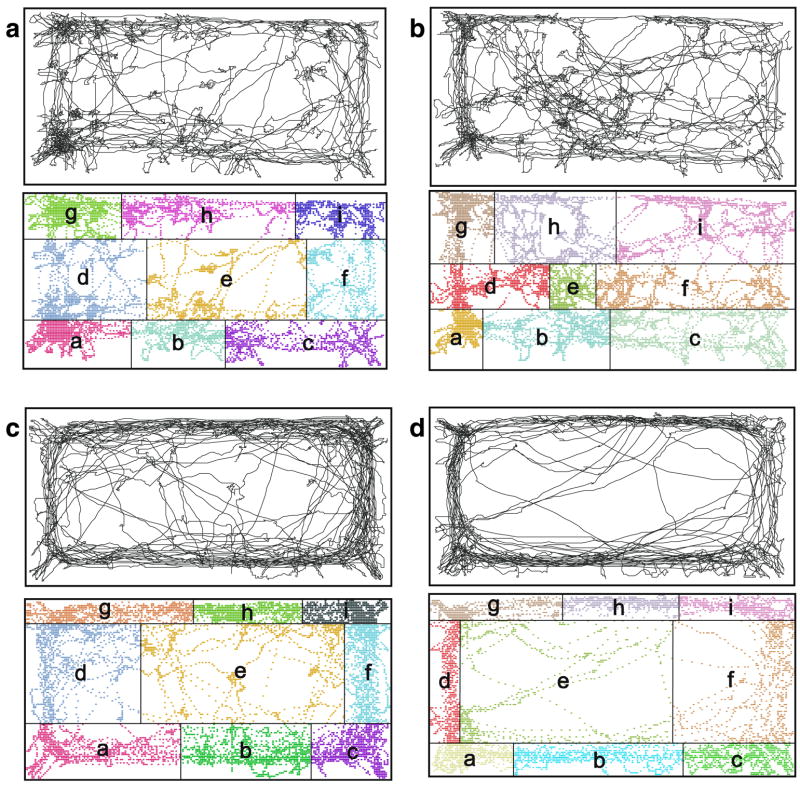
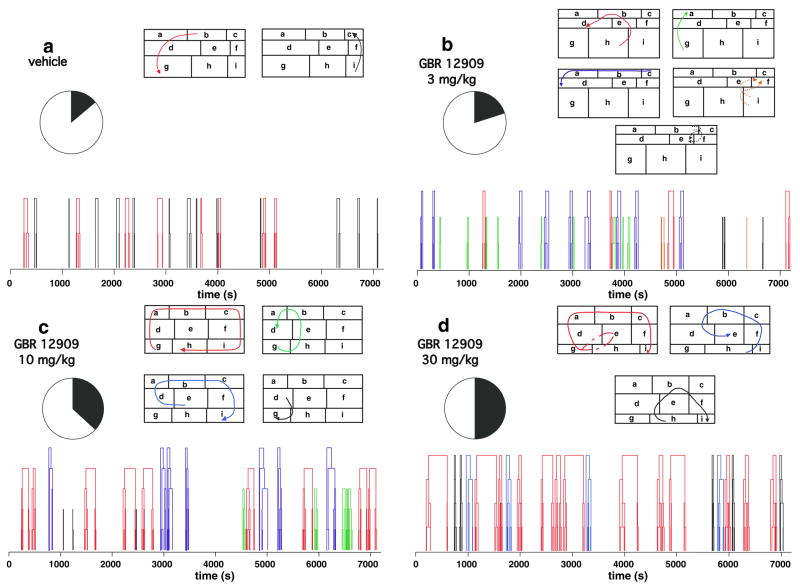
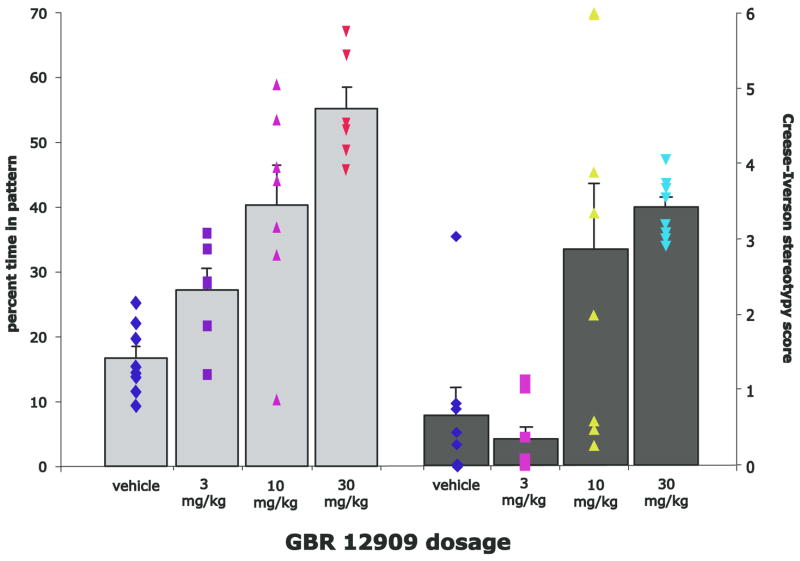
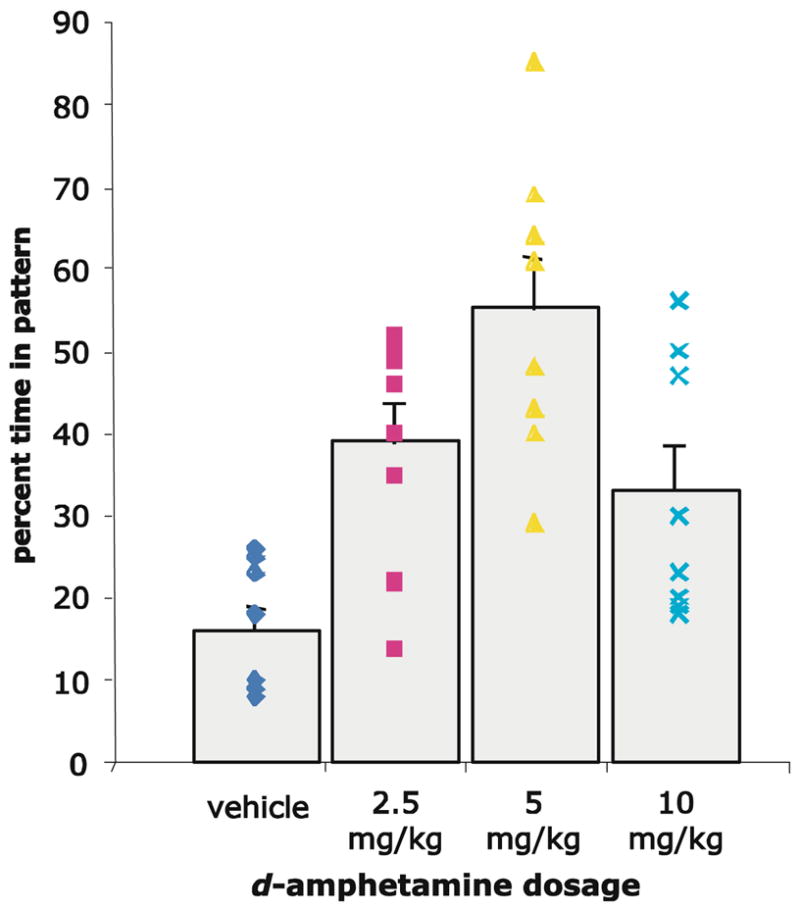
Results: Mouse home-cage locomotor patterns were recorded after psychostimulant administration (GBR 12909, 0, 3, 10, and 30 mg/kg; d-amphetamine, 0, 2.5, 5, and 10 mg/kg). After treatment with GBR 12909, dose-dependent increases in the number of found patterns and overall pattern length and depth were observed. Similar findings were seen after treatment with d-amphetamine up to the dosage where focused stereotypies dominated behavioral response. For both psychostimulants, detected patterns displayed similar morphological features. Pattern sets containing a few frequently repeated patterns of greater length/depth accounted for a greater percentage of overall trial duration in a dose-dependant manner. This finding led to the development of a t-pattern-derived route-tracing stereotypy score. Compared to scores derived by manual observation, these t-pattern-derived route-tracing stereotypy scores yielded similar results with less within-group variability. These findings remained similar after reanalysis with removal of patterns unmatched after human scoring and after normalization of locomotor speeds at low and high ranges.

Conclusions: T-pattern analysis is a versatile and robust pattern detection and quantification algorithm that complements currently available observational phenotyping methods.


Figures

Fig 1
Fig 1
Maximum entropy binning of locomotor paths using box constraints. This algorithm converts locomotor data from position as a function of time to bin as a function of time. a Representative locomotor path and bin structure for mouse receiving vehicle injection. b 3 mg/kg GBR 12909. c 10 mg/kg GBR 12909. d 30 mg/kg GBR 12909. Note that increasing doses of GBR 12909 organized locomotor behavior along the arena boundaries, a characteristic of route-tracing stereotypy
Fig 2
Fig 2
Determination of individual t-patterns from locomotor paths. a Locomotor path (from Fig. 1a) with superimposed maximum entropy binning. b T-pattern testing for sequence of {h,e,b,c,f,i}. The diagram at the right depicts transitions from these states over the trial duration (transitions from the three states not included in the pattern are not shown). Note that the pattern of {h,e,b,c,f,i} is formed by combining t-patterns of {h,e,b} and {c,f,i}. Full elaborations of the pattern are depicted in red in the transition diagram; partial elaborations are depicted in black. c Locomotor path corresponding to second occurrence of {h,e,b,c,f,i} pattern (note asterisk). Other occurrences of this pattern trace similar paths. d Dendrogram plot of {h,e,b,c,f,i} pattern vs time. This plot depicts the temporal occurrence of the pattern, as well as an idealized representation of its length and depth. Note that this relatively long/deep pattern is repeated only four times throughout the trial, and accounts for a relatively small percentage of total trial duration
Fig 3
Fig 3
Pattern composition: selecting the subset of nonoverlapping, detected patterns to cover the greatest fraction of trial duration. Representative examples for vehicle (a), GBR 12909 3 mg/kg (b), 10 mg/kg (c), 30 mg/kg (d). Note trend of increasing pattern coverage of overall trial using fewer patterns as GBR 12909 dosage increased. Drawings depict each pattern included in the maximal composition; color of the patterns in these drawings corresponds to dendrogram color in the dendrogram vs time plot (time in seconds). Dotted lines represent patterns where a state within the dendrogram was equally likely to transition into one of two immediately adjacent bins. Pie chart depicts fraction of total trial duration accounted for by patterns
Fig 4
Fig 4
Comparison of t-pattern-derived route-tracing stereotypy score (light grey bars) with manual observation-derived stereotypy score (dark grey bars). T-pattern-derived route-tracing stereotypy scores increase with greater doses of GBR 12909. Individual route-tracing stereotypy score values for each dosage overlaid on respective bar. Error bars are ±1 standard error. Note significantly less within-group variability when analysis performed using t-patterns. One-way ANOVA on dosage effect for t-pattern derived route-tracing stereotypy score F3,24=48.53 (p<0.00001, r2=0.78, all pairwise comparisons significant by Duncan’s multiple range test); for human observer-derived (Creese–Iverson) stereotypy score F3,27=9.65 (p<0.0002, r2= 0.21, pairwise comparisons between vehicle and 10 mg/kg, vehicle and 30 mg/kg, 3 and 10 mg/kg, 3 and 30 mg/kg groups significant by Duncan’s multiple range test)
Fig 5
Fig 5
T-pattern-derived route-tracing stereotypy scores increase with greater doses of d-amphetamine. Individual route-tracing stereotypy score values for each dosage overlaid on respective bar. Error bars are ±1 standard error. One-way ANOVA on dosage effect for t-pattern derived route-tracing stereotypy score F3,28=9.91 (p<0.0001, r2= 0.51, pairwise comparisons between vehicle and 2.5 mg/kg and vehicle and 5 mg/kg, significant by Duncan’s multiple range test). Decreased route-tracing stereotypy score observed in group receiving d-amphetamine 10 mg/kg reflects the development of the amphetamine response stationary phase (Schiørring 1971; also referred to as focused stereotypy, Canales and Graybiel 2000) as the trial progressed

Similar articles

Cited by

References

    1. Aldridge JW, Berridge KC. Coding of serial order by neostriatal neurons: a “natural action” approach to movement sequence. J Neurosci. 1998;18:2777–2787. - PMC - PubMed
    1. Bäck T. Evolutionary algorithms in theory and practice—evolution strategies, evolutionary programming, genetic algorithms. Oxford University Press; Oxford, UK: 1996.
    1. Bakeman R, Gottman JM. Observing interaction. An introduction to sequential analysis. Cambridge University Press; Cambridge UK: 1997.
    1. Barwick VS, Jones DH, Richter JT, Hicks PB, Young KA. Subthalamic nucleus microinjections of 5-HT2 receptor antagonists suppress stereotypy in rats. Neuroreport. 2000;11:267–270. - PubMed
    1. Borrie A, Jonsson GK, Magnusson MS. Temporal pattern analysis and its applicability in sport: an explanation and exemplar data. J Sports Sci. 2002;20:845–852. - PubMed

Publication types