. 2008 Feb;47(2):613-24.
doi: 10.1002/hep.22029.

S-adenosylmethionine prevents Mallory Denk body formation in drug-primed mice by inhibiting the epigenetic memory

Affiliations

S-adenosylmethionine prevents Mallory Denk body formation in drug-primed mice by inhibiting the epigenetic memory

Jun Li et al. Hepatology. 2008 Feb.

Abstract

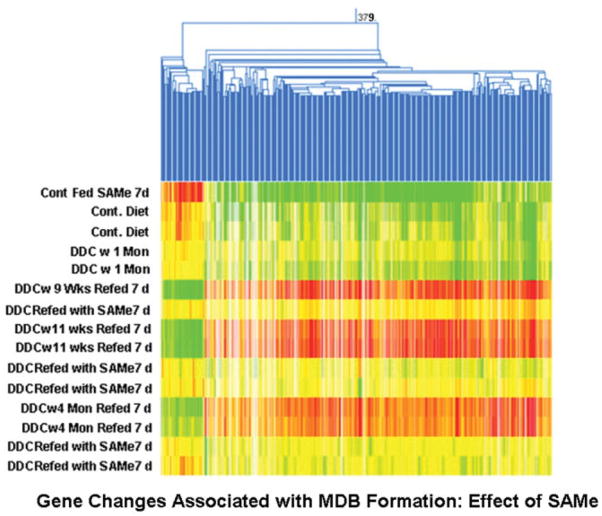
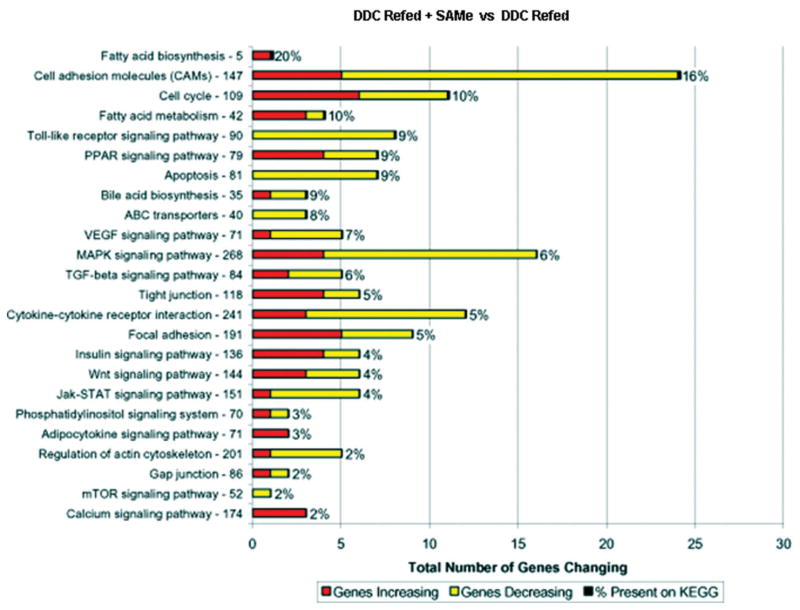
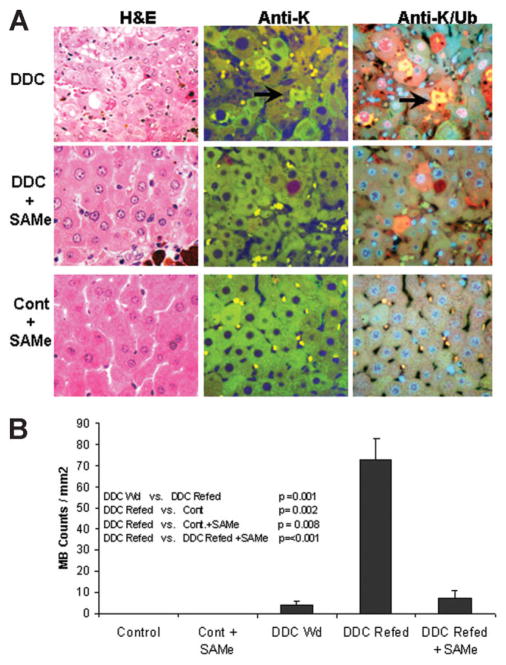
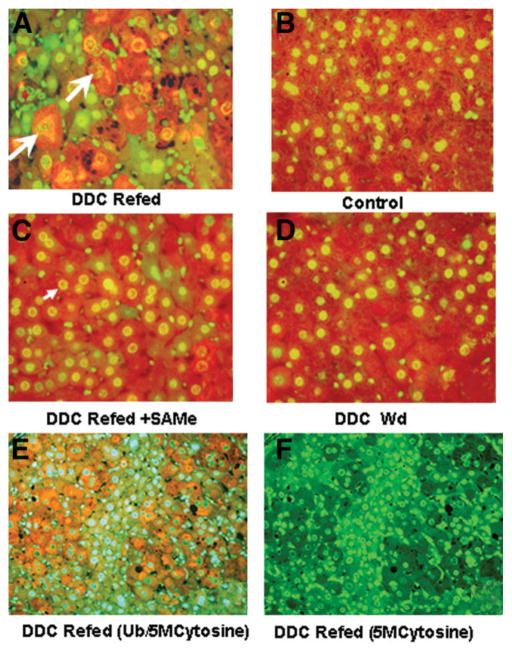
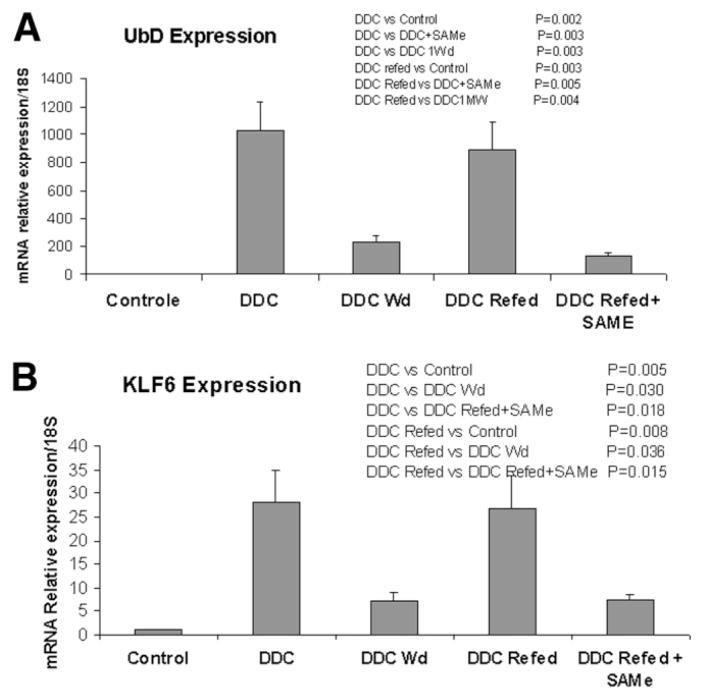
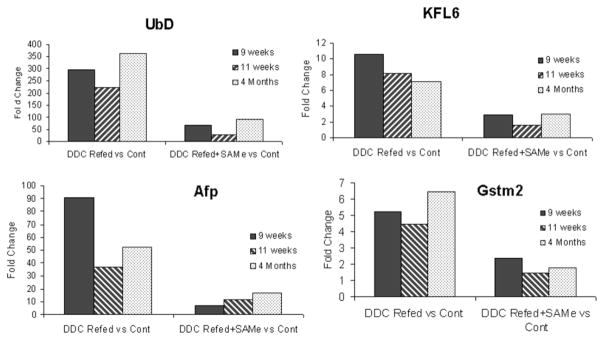
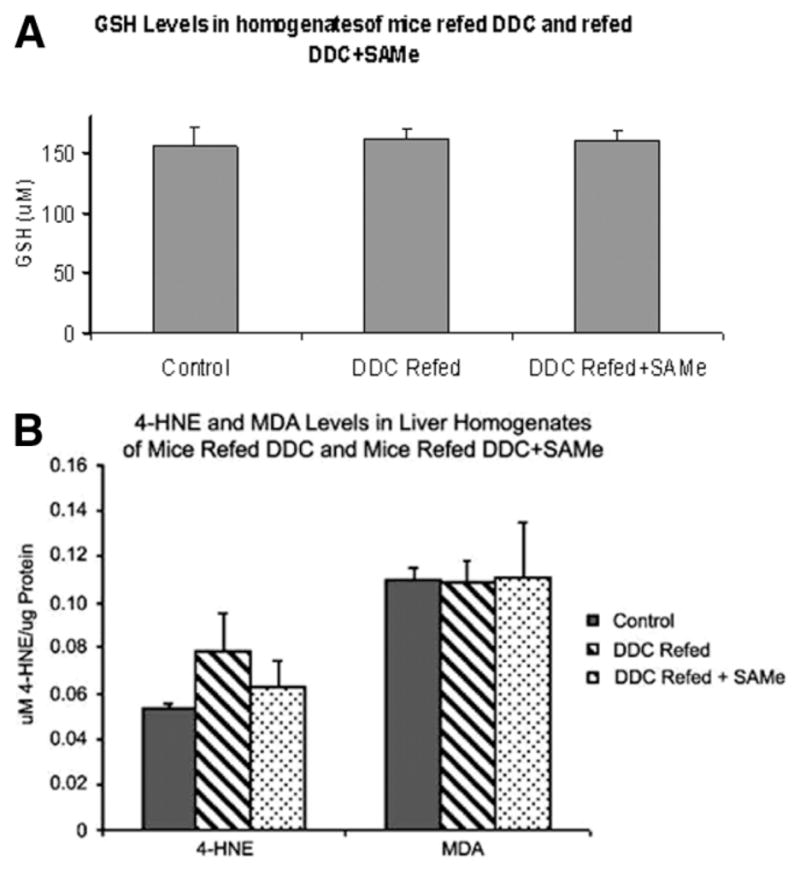
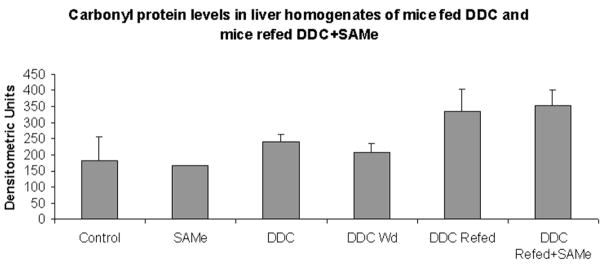
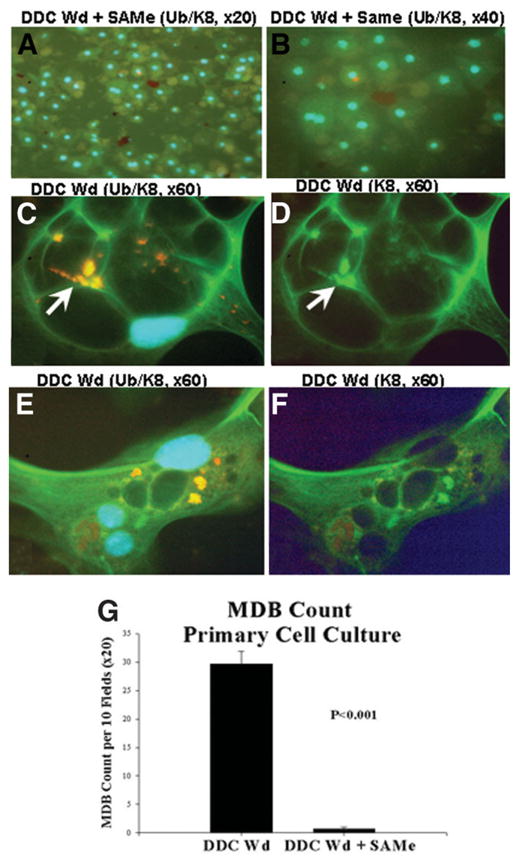
In previous studies, microarray analysis of livers from mice fed diethyl-1,4-dihydro-2,4,6-trimethyl-3,5-pyridine decarboxylate (DDC) for 10 weeks followed by 1 month of drug withdrawal (drug-primed mice) and then 7 days of drug refeeding showed an increase in the expression of numerous genes referred to here as the molecular cellular memory. This memory predisposes the liver to Mallory Denk body formation in response to drug refeeding. In the current study, drug-primed mice were refed DDC with or without a daily dose of S-adenosylmethionine (SAMe; 4 g/kg of body weight). The livers were studied for evidence of oxidative stress and changes in gene expression with microarray analysis. SAMe prevented Mallory Denk body formation in vivo. The molecular cellular memory induced by DDC refeeding lasted for 4 months after drug withdrawal and was not manifest when SAMe was added to the diet in the in vivo experiment. Liver cells from drug-primed mice spontaneously formed Mallory Denk bodies in primary tissue cultures. SAMe prevented Mallory Denk bodies when it was added to the culture medium.

Conclusion: SAMe treatment prevented Mallory Denk body formation in vivo and in vitro by preventing the expression of a molecular cellular memory induced by prior DDC feeding. No evidence for the involvement of oxidative stress in induction of the memory was found. The molecular memory included the up-regulation of the expression of genes associated with the development of liver cell preneoplasia.


Conflict of interest statement

Potential conflict of interest: Nothing to report.

Figures

Fig. 1
Fig. 1
Heat map showing the changes in gene expression when DDC was refed 7 days to mice withdrawn from DDC for 9 weeks, 11 weeks, and 4 months. 379 refers to 379 genes that were associated with MDB formation: the effect of SAMe. The blue lines are branches or nodes of the gene tree for clustering analysis of related genes. The green lines indicate a low level of gene expression. The yellow lines are an indication of average gene expression. The red lines are an indication of a high level of gene expression. The white lines are an indication of too low expression to be valid. The gene expression pattern was the same for each time period, that is, 9 weeks, 11 weeks, and 4 months, as indicated by the mostly red and green columns. This indicated that the cellular memory of the drug-primed mice was not diminished by 4 months’ withdrawal. DDC-refed mice for which SAMe was added to the diet failed to undergo the changes induced by DDC refeeding, as indicated by the mostly yellow columns, and this indicated that the SAMe treatment prevented the gene changes induced by DDC refeeding.
Fig. 2
Fig. 2
SAMe inhibited the changes in gene expression in the functional pathways up-regulated by DDC refeeding. The time period includes 4-month-withdrawal refed DDC and refed DDC and SAMe, 11-month-withdrawal refed DDC and refed DDC and SAMe, and 9-month-withdrawal refed DDC and SAMe. The functional pathway data illustrated were obtained by the use of the KEGG Web site (http://www.genome.jp/kegg/pathway.html) and by the blasting of the list of total changed genes combined from the pairs of DDC-withdrawn/refed mice. The Web site calculates the number of up-regulated and down-regulated genes for each pathway shown in the KEGG graph. To determine the percent gene change in each pathway, the number of changed genes present in each pathway was divided by the total number of genes in the same pathway. Most of the pathways up-regulated by DDC refeeding were down-regulated by SAMe treatment, as indicated by the increase in the percentage of genes down-regulated by SAMe. ABC indicates adenosine triphosphate– binding cassette; Jak-STAT, Janus kinase–signal transducer and activator of transcription; MAPK, mitogen-activated protein kinase; mTOR, mammalian target of rapamycin; PPAR, peroxisome proliferator-activated receptor; TNF-beta, transforming growth factor beta; and VEGF, vascular endothelial growth factor.
Fig. 3
Fig. 3
(A) When the livers from the control and DDC-refed mice were stained with H&E and immunohistochemically, it was shown that SAMe fed with DDC prevented MDB formation. H&E stain (column A), K8 antibody (column B) and combined Ub/K8 antibody stain and DAPI nuclear stain (column C) are shown. The K8/Ub antibody stains are of the same cells: they stain green for K8 and yellow for colocalized Ub/CK8. MDBs (arrow) were stained yellow because they were both Ub-positive and K8-positive. The hepatocytes that stained red for Ub are potentially MDB-forming cells seen in DDC-withdrawn mice livers. The control and SAMe-treated livers stained with the K8 antibody showed prominent lysosomal granules in the cytoplasm. The deep red body is autofluorescent protoporphyrin. The liver histologic changes show that MDB formation in response to DDC and SAMe treatment prevented these changes (×840). (B) The number of MDBs was counted in the various treatment groups, showing that SAMe treatment prevented MDB formation. When the MDBs were counted in the livers of DDC-withdrawn mice, DDC-refed mice and DDC-refed mice fed SAMe were compared: DDC refeeding induced an increase in MB formation (Fig. 3B). When SAMe was added to the DDC diet in the combined data from 5 pairs of mice refed DDC, it prevented this induction (Fig. 3B). Ten random fields at 40× magnification were counted and blinded as to treatment (mean ± standard error; n for DDC-withdrawn = 3, n for DDC-withdrawn/refed + SAMe = 5, and n for DDC-withdrawn/refed = 5).
Fig. 4
Fig. 4
Livers from the mice refed DDC with or without SAMe were double-stained with an antibody to S-methyl cytosine and Ub to assess the amount of DNA and histone methylation in the liver cell nuclei in normal and MDB-forming cells (arrows). (A) The cells that formed MDBs had enlarged vesicular nuclei with very little 5-methyl cytosine–positive staining (long arrow) compared to the normal hepatocyte and nonparenchymal nuclei, which were smaller and had condensed chromatin (short arrows). The nuclei that stained yellow were both 5-methyl cytosine–positive (green) and Ub-positive (red) and combined to give a fluorescent yellow color. (C) The nuclei in the livers of mice refed DDC with SAMe resembled (B) the normal controls and (D) the DDC-withdrawn controls (×840). (E) Liver sections from mice refed DDC had reduced methylation of nuclei in MDB-forming cells in comparison with the normal hepatocytes. Nuclei stained green for 5-methylcytosine. (A) Two large groups of hepatocytes that stained positive for Ub (red) and formed MDBs were separated by normal stained hepatocytes. (F) When the stain for 5-methyl cytosine was used, the nuclei of the normal hepatocytes stained bright green in comparison with the MB-forming cells, which only lightly stained green or were unstained. They were immunohistochemically double-stained for 5-methyl cytosine (green) and Ub (red; ×420).
Fig. 5
Fig. 5
(A) When the levels of UBD expression were accessed by RT-PCR and the differences between treatment groups were compared, there was an increase in all experimental groups compared to controls. However, the 3 SAMe-fed + DDC-refed mice, compared with DDC-withdrawal mice, were not different, indicating that SAMe prevented the increased expression caused by DDC refeeding (mean ± standard error of the mean; n = 3). The mice refed DDC + SAMe were withdrawn at 11 weeks or 4 months (n = 3). The mice refed DDC were withdrawn at 1 or 4 months (n = 3). (B) When the levels of KLF6 expression levels were assessed by RT-PCR and the differences between treatment groups were compared, there was an increase in all experimental groups compared with the controls. However, when the 3 SAMe-fed + DDC-refed mice were compared with DDC-withdrawn mice, there was no difference, and this indicated that SAMe prevented the increased expression caused by DDC refeeding (mean ± standard error; n = 3). The mice were withdrawn as in panel A.
Fig. 6
Fig. 6
Microarray analysis of the expression of UBD, KLF6, Afp, and GSTmu2 showed that the DDC refeeding–induced cellular memory persisted after 9 and 11 weeks’ withdrawal and up to 4 months’ withdrawal. The response was blocked by SAMe feeding with DDC.
Fig. 7
Fig. 7
(A) Oxidative stress parameters were measured in the livers of DDC-withdrawn/refed mice. GSH was measured in the livers from mice refed DDC (n = 5), mice refed DDC with SAMe (n = 5), and controls (n = 2). This included 9-week, 11-week, and 4-month DDC-withdrawn/refed pairs of mice. There was no significant difference between groups (mean ± standard error of the mean). (B) 4-HNE and MDA levels in liver homogenates from mice refed DDC, with or without SAMe, were not significantly different from one another other or the controls. This included 9-week, 11-week, and 4-month DDC-withdrawn/refed pairs of mice (mean ± standard error of the mean; n = 5 for DDC with or without SAMe and n = 2 for controls).
Fig. 8
Fig. 8
There was no increase in protein carbonyl levels in the liver homogenates of mice refed DDC with or without SAMe when they were compared to one another and controls. This includes 9-week, 11-week, and 4-month refed pairs of mice (mean ± standard error of the mean; n = 5 for the control, n = 7 for DDC, n = 3 for DDC-withdrawal, n = 3 for DDC-refed, n = 4 for DDC-refed with SAMe, and n = 1 for SAMe-fed).
Fig. 9
Fig. 9
(A,B) MDB (arrows) formation by drug-primed hepatocytes was inhibited in vitro by the addition of SAMe to the medium (×420 and ×840, respectively) in comparison with (C–F) drug-primed hepatocytes without SAMe added (×1260). (D,F) The MDBs that formed had green fluorescence with the K8 antibody in comparison with (C,E) the same cells double-stained for Ub/K8, which showed that the MDBs fluoresced yellow because they stained positive with the antibodies to both Ub and K-8. The hepatocytes and their nuclei were much larger (C–F) in the MDB-forming cells in comparison with (A,B) the SAMe-treated cells. The antibodies used (double-stained) were anti-K8 (green) and anti-Ub (red). The nuclei stained blue with DAPI. (G) MDB counts were performed on tissue cultures of drug-withdrawn mice livers. All MDBs were counted that had irregular outlines per millimeter squared. Cultures of DDC-withdrawn/refed cells were compared with SAMe-treated cultures; 10 random fields (×20) were counted per well. MDBs were rarely found in the SAMe-treated cultures, whereas numerous MDBs were found in the control cultures (mean ± standard error of the mean; n = 9, P < 0.01).

Similar articles

Cited by

References

    1. Zatloukal K, French SW, Stumptner C, Strnad P, Harada M, Toivola DM, et al. From Mallory to Mallory-Denk bodies: what, how and why? Exp Cell Res. 2007;313:2033–2049. - PubMed
    1. French BA, van Leeuwen F, Riley NE, Yuan QX, Bardag-Gorce F, Lue YH. Aggresome formation in liver cells in response to different toxic mechanisms. Role of the ubiquitin-proteasome pathway and the frameshift mutant of ubiquitin. Exp Mol Pathol. 2001;71:241–246. - PubMed
    1. Riley NE, Li J, McPhaul L, Lue Y, French SW. Heat shock proteins and Mallory bodies (cytokeratin aggresomes) in human liver biopsies. Exp Mol Pathol. 2003;74:168–174. - PubMed
    1. Zhang-Gouillon ZQ, Yuan QX, Hu B, Gaal K, Marceau N, French SW. Alcohol induces Mallory body formation in drug-primed mice. Hepatology. 1998;27:116–122. - PubMed
    1. Yuan Q, Nagao Y, Wan Y, Hu B, Gaal K, French BA, et al. Mechanisms of Mallory body formation induced by okadaic acid in drug primed mice. Exp Mol Pathol. 1998;65:87–103. - PubMed

Publication types