. 2008 Feb 1;314(1):40-58.
doi: 10.1016/j.ydbio.2007.10.056. Epub 2007 Nov 28.

Notch2 is required for maintaining sustentacular cell function in the adult mouse main olfactory epithelium

Affiliations

Notch2 is required for maintaining sustentacular cell function in the adult mouse main olfactory epithelium

Steve Rodriguez et al. Dev Biol. .

Abstract

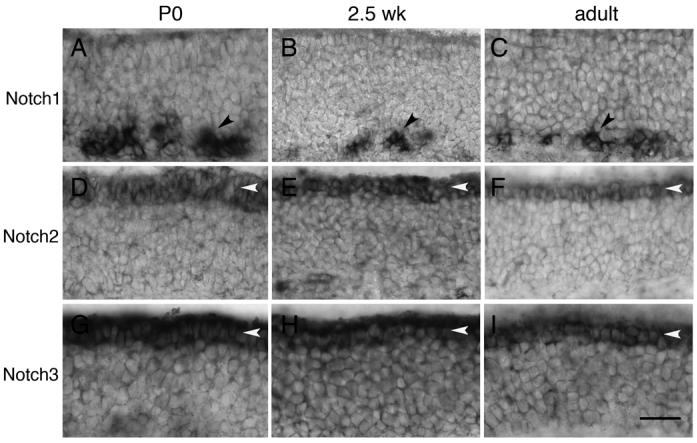
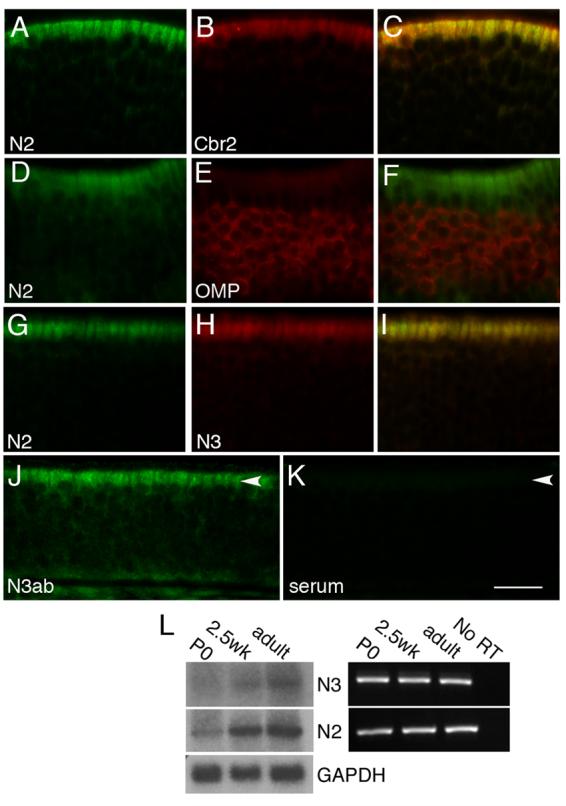
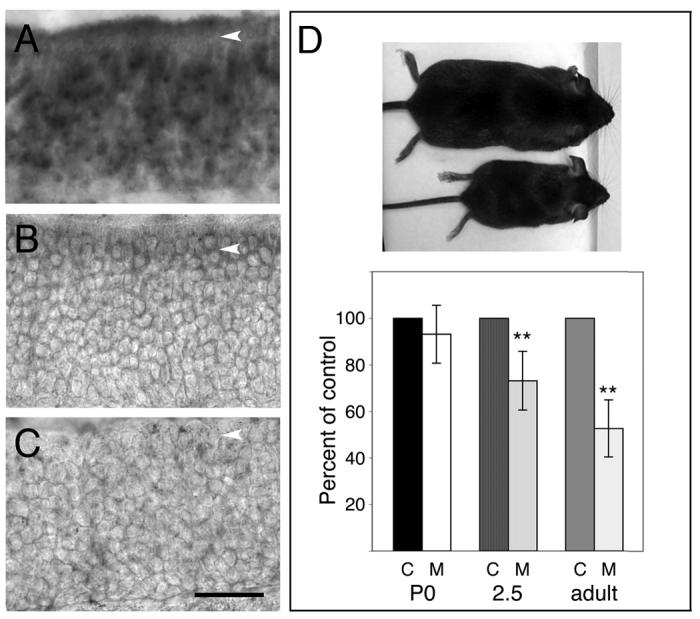
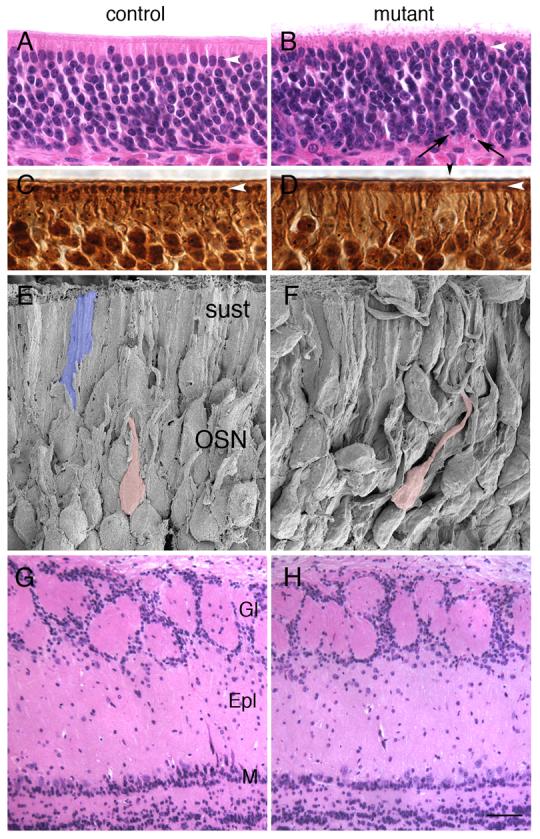
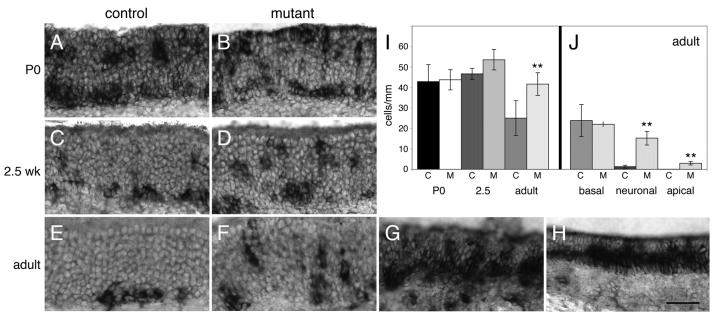
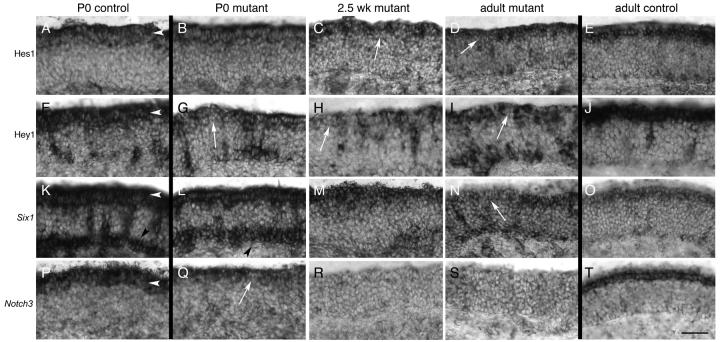
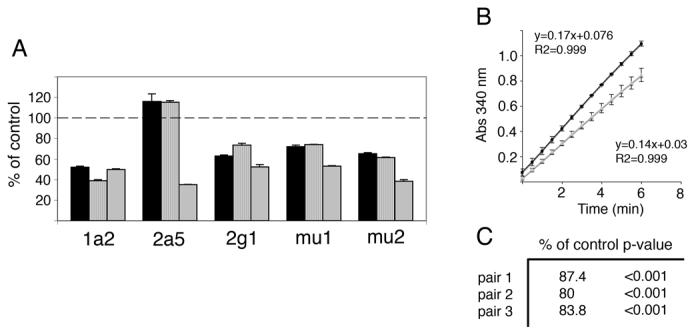
Notch receptors are expressed in neurons and glia in the adult nervous system, but why this expression persists is not well-understood. Here we examine the role of the Notch pathway in the postnatal mouse main olfactory system, and show evidence consistent with a model where Notch2 is required for maintaining sustentacular cell function. In the absence of Notch2, the laminar nature of these glial-like cells is disrupted. Hes1, Hey1, and Six1, which are downstream effectors of the Notch pathway, are down-regulated, and cytochrome P450 and Glutathione S-transferase (GST) expression by sustentacular cells is reduced. Functional levels of GST activity are also reduced. These disruptions are associated with increased olfactory sensory neuron degeneration. Surprisingly, expression of Notch3 is also down-regulated. This suggests the existence of a feedback loop where expression of Notch3 is initially independent of Notch2, but requires Notch2 for maintained expression. While the Notch pathway has previously been shown to be important for promoting gliogenesis during development, this is the first demonstration that the persistent expression of Notch receptors is required for maintaining glial function in adult.


Figures

Figure 1
Figure 1. Expression of Notch receptors during postnatal stages
A-C) Notch1 is expressed in the basal epithelium (black arrowheads) by a subset of cells located primarily in the dorsal recess. This expression is present at P0, 2.5 weeks, and in adult (8-19 weeks). D-F) Notch2 is expressed by sustentacular cells (white arrowheads) at P0, 2.5 weeks, and adult. Expression is also detected in the lamina propria (data not shown). G-I) Notch3 is expressed by sustentacular cells (white arrowheads) at P0, 2.5 weeks, and adult. Expression is also detected in the lamina propria (data not shown). Scale bar=40μm.
Figure 2
Figure 2. Notch receptor expression in sustentacular cells
A-C) Double-label in situ hybridization in adult epithelia of Notch2 (A) and Cbr2 (B), an enzyme expressed by sustentacular cells, show that both are localized to the sustentacular layer (C). D-F) Notch2 (D) and OMP (E), a marker for mature OSNs, are not co-expressed in the neuronal layer (F). G-I) Notch2 (G) and Notch3 (H) are both expressed in the sustentacular layer (I). J) Immunohistochemical detection of NOTCH3 protein in adult animals in sustentacular cells (arrowhead). K) No signal is detected in sustentacular cells (arrowhead) in the absence of anti-NOTCH3 antibody. Scale bar=25μm for A-I, 17μm for J-K. L) RNA isolated from whole epithelia was used for Northern blot and RTPCR. Notch2 and Notch3 message can be detected at P0, 2.5 weeks, and adult stages. GAPDH was used as a loading control for the Northern blot.
Figure 3
Figure 3. Notch2 is effectively deleted in mutant mice and mutant animals are smaller than control siblings
A) Foxg1-cre animals (Hebert and McConnell, 2000) were crossed to the Rosa26-LacZ reporter strain (Soriano, 1999). Sections from P0 progeny were assayed for β-galactosidase activity and counterstained with eosin. β-galactosidase expression was detected in the sustentacular layer (arrowhead) and throughout the apical-basal extent of the epithelium. B) Exon 3 (260 bp; deleted in N2flox/flox; Foxg1-cre animals (McCright et al., 2006)) was used as probe to detect expression of Notch2 in control and mutant animals. Message could be detected within sustentacular cells of adult control animals (arrowhead). C) No Notch2 message could be detected with the exon 3 probe in N2flox/flox; Foxg1-cre animals (arrowhead). D) Notch2 mutant animals were smaller than their control siblings (top mouse-control adult; bottom mouse-mutant adult). Animals were weighed at P0, 2.5 weeks, and adult (8-19 weeks) stages to determine when this weight difference became apparent. At P0, the average weight of controls (c-control, 1.6±0.1g) did not differ significantly from mutants (m-mutant, 1.8±0.2g; n=4 pairs; p=0.3, Student's t-test). However, by 2.5 weeks, mutants were on average 27% less in weight than control siblings (n=8 pairs; control: 8.1±1.4g; mutant: 5.8±1.0g; p=0.003). Although adult animals were weighed at different ages (8-19 weeks), control siblings were always compared with mutant siblings. On average, mutants weighed 47% less than controls (n=13 pairs; control: 24.7g±4.3; mutant: 12.8g±3.0; p=2.1×10⁻⁸, Student's t-test). Scale bar=40μm.
Figure 4
Figure 4. Disruption of epithelial structure in adult Notch2 mutants
White arrowheads indicate sustentacular layer in A-D. A,B) Hematoxylin and eosin staining of control (A) and mutant (B) adult animals. Disruption of the organization of the sustentacular layer is apparent in mutants as compared with controls (white arrowhead). Pyknotic nuclei (black arrows) could be seen in mutant sections. C,D) Bielschowsky staining revealed gaps (black arrowhead) in the relatively uniform distribution of dendritic tufts (white arrowhead) in mutants (D) as compared against controls (C). E,F) Scanning electron micrograph from control (E) and mutant (F) adult animals show increased disorganization within the neuronal layer. Compare dendritic path of two neurons pseudocolored pink. Typical sustentacular cell pseudocolored blue (E). G,H) Hematoxylin and eosin staining of control (G) and mutant (H) adult olfactory bulbs. No differences in laminar structure were observed. Gl: glomerular layer, Epl: external plexiform layer, M: mitral layer. Scale bar=20μm for A-B, 10μm for C-D, 5μm for E-F, 62.5μm for G-H.
Figure 5
Figure 5. Variability in epithelial degeneration in Notch2 mutants
A-B) Low power images of DAPI stained coronal sections from control (A) and mutant (B) epithelium. Boxed areas are represented in (C) and (D). Brackets highlight regions of epithelia (C,D). E,F) Tracing of epithelia of in (C) and (D) to illustrate variability in mutant epithelium as compared with control. Scale bar=500μm for A-B, 300μm for C-D.
Figure 6
Figure 6. Increased apoptosis in Notch2 mutants
A) TUNEL staining was used to assay levels of apoptotic cell death in control animals. Apoptotic cells were sparsely distributed in adult animals, and were generally detected in the basal and neuronal layers (arrowhead). B) TUNEL staining in Notch2 mutants appeared more widespread, with many areas outside the basal layer showing increased expression relative to control (arrowhead). C) TUNEL staining in some regions of Notch2 mutant epithelia was dramatically elevated (e.g. arrowheads). D,E) Quantitation of TUNEL expression. “C” indicates control and “M” indicates mutant. D) The distribution of TUNEL positive cells in control and mutant adults were binned by location into basal, neuronal, and apical layers. No significant differences were observed in the basal layer (control: 6.9±1.8 cells/mm; mutant: 6.8±1.7 cells/mm; p=0.7; Student's t-test). However, in the neuronal layer (control: 2.4±1.1 cells/mm; mutant: 7.9±1.1 cells/mm; p=0.005) and in the apical layer (control: 0 cells/mm; mutant: 0.3±0.1 cells/mm; p=0.01) significant differences were observed. The bulk of the TUNEL-positive cells in the mutant were present in the neuronal layer. E) Quantification of total TUNEL cells per millimeter throughout the apical-basal extent of the epithelium was performed in P0 (n=3 pairs: 6-18mm/animal), 2.5 week-old (n=3 pairs: 7-15mm/animal), and adult (n=3 pairs: 3-8mm/animal) control and mutant animals. No significant differences were detected at P0 (control: 29.0 ±8.2 cells/mm; mutant: 29.5±3.0 cells/mm; p=0.9), or at 2.5 weeks (control: 26.3±6.2 cells/mm; mutant: 27.5±3.7 cells/mm; p=0.8). However, in adult animals, there were significant differences between control and mutant (control: 8.2±1.0 cells/mm; mutant: 14.8±2.8 cells/mm; p=0.02; asterisks indicate significant differences relative to control). Quantitation of data in (D) and (E) excluded all areas similar to those shown in (C), as it was impossible to determine the number of positive cells per millimeter in such regions. Scale bar=25μm.
Figure 7
Figure 7. Cell fate is unaffected in Notch2 mutant adults
>A) Scg10 expression in adult control animals is basally located in developing immature OSNs (arrowhead). B) Expression of Scg10 can be detected in Notch2 mutants (arrowhead), but this expression is uneven. Some areas have significantly elevated expression (B-left panel; white arrow), while others have patchy or no Scg10 expression (B-right panel; white arrow). C) OMP expression in control animals is detected in mature OSNs within the neuronal layer. D) OMP expression in mutant animals is similar to that in control. However, the apical surface of OMP expression is less laminar in appearance. In several areas, OMP expression appears to extend into the apical layer (white arrow). E) Control expression of Cytokeratin8 (Krt8) is detected in the sustentacular layer (arrowhead) and in Bowman's glands (black arrow). F) Krt8 is detected in the sustentacular layer of mutant animals (arrowhead). G) O-MACS expression in control animals is detected in the dorsal-most zone of the epithelium (arrowhead shows sustentacular layer). H) O-MACS is also detected in a similar pattern in Notch2 mutants in the sustentacular layer (arrowhead). Scale bar=50μm.
Figure 8
Figure 8. Extreme examples of degenerating epithelia in Notch2 mutants
All images are taken from Notch2 adult mutants. A,B) OMP expression is dramatically affected in some areas of epithelia (areas to right of arrows). C,D) Hes1 expression is strongly affected in some areas of mutant epithelia, with an increase in the number of Hes1-positive cells in the basal and neuronal layers (arrowheads). Scale bar=50μm.
Figure 9
Figure 9. Mash1 expression is elevated in adult mutants
A,B) Mash1 expression in P0 control (A) and mutant (B) animals are similar. C,D) Mash1 expression in 2.5 week-old control (C) and mutant (D) are also similar. E,F) Multiple regions can be found in adult mutant animals that appear to have increased numbers of Mash1-expressing cells (F) as compared against control (E). G,H) In some extreme instances, very high numbers of Mash1-expressing cells can be found in regions of mutant epithelia (compare with (E)). I) Quantitation of the total number of Mash1-expressing cells per millimeter (c-control; m-mutant) showed no significant differences at P0 (8-15mm counted/animal; control: 42.9±8.3 cells/mm; mutant: 43.7±5.0 cells/mm; p=0.9, Student's t-test). No differences were found at 2.5 weeks (5-26mm counted/animal; control: 46.6±2.7 cells/mm; mutant: 53.5±10.3 cells/mm; p=0.3). However, significant differences were found in adult (7-14mm counted/animal; control: 25±8.5 cells/mm; mutant: 41.7±5.5 cells/mm; p=0.05; asterisks indicate significant differences relative to control). J) We quantified the distribution of Mash1-expressing cells in adults in the basal, neuronal, and apical layers of the epithelium. No significant differences were found in the basal layer (control: 23.8±7.9 cells/mm; mutant: 22.0±1.2 cells/mm; p=0.7). However, in the neuronal (control: 1.3±0.7 cells/mm; mutant: 15.2±3.3 cells/mm; p=0.004) and apical layers (control: 0.1±0.1 cells/mm; mutant: 3.0±0.8 cells/mm; p=0.008), significant differences were identified between mutant and control. Quantification does not include areas of epithelia with extremely high levels of Mash1 expression (e.g. G,H). Scale bar=50μm.
Figure 10
Figure 10. Down-regulation of Hes1, Hey1, Six1, and Notch3 in the absence of Notch2
In all panels, arrowheads point to the position of the sustentacular layer. For comparison, P0 and adult controls for each probe are shown. A,E) Expression of Hes1 at P0 (A) and adult (E) control animals. B-D) No significant differences in Hes1 expression could be detected at P0 in mutants (B). Subtle differences were observed at 2.5 weeks, as there was an apparent decrease in the number of Hes1-expressing cells in the apical epithelium (C; arrow). However, a clear reduction in Hes1 expression could be seen in adult mutants (D: white arrow shows large gap in Hes1 expression). Hes1 positive cells can also be detected scattered in the neuronal and basal layers. F,J) Hey1 is evenly expressed in sustentacular cells at P0 (F) and in adult (J) controls. Hey1 is also expressed in an unknown population of cells distributed deep to the sustentacular layer. G-I) Hey1 expression is strongly affected at P0 (G), 2.5 weeks (H), and adult (I) in Notch2 mutants. Significant disruption of apical Hey1 expression is observed at all stages, with gaps in the normal, uniform apical expression (arrows). Increased expression is also seen in basal cells in mutants relative to controls (I). K,O) Expression of Six1 in P0 (K) and adult (O) control animals. Six1 is expressed in P0 animals strongly in the sustentacular and basal layers, and in cells distributed in the neuronal layer. Only a small number of basally-located cells express Six1 in control adults (O). L-N) Six1 expression in P0 (L) and 2.5 week (M) mutant animals appears minimally or subtly affected. However, in adult (N) mutant animals, gaps in Six1 expression could be seen apically (arrow). P,T) Expression of Notch3 in P0 (P) and adult (T) control animals. Q-S) Expression of Notch3 in P0 mutant (Q) animals is clearly detectable in the sustentacular layer, but this expression is more variable than control, and is also reduced in expression (arrow). Weak or no expression of Notch3 is observed in 2.5 week-old (R) or adult (S) Notch2 mutants. Scale bar=50μm.
Figure 11
Figure 11. Quantitation of P450 and GST expression and determination of GST activity
A) Quantitative RT-PCR of P450 and GST isoform expression levels in three mutant epithelia as compared with control. Reduction of P450 isoforms Cyp1a2 and Cyp2g1 and GST isoforms mu1 and mu2 RNA are seen in all three mutant epithelia relative to control. Expression of Cyp2a5 is somewhat increased in two mutants, but strongly decreased in the third mutant. This may be a result of the ages of the mutant samples. The first two epithelia are obtained from 1 month old animals, while the third is from an animal 9 weeks old. B) Example graph of GST activity from one paired mutant and control assay. Black line (circles) represents control epithelial extract and gray line (triangles) represents mutant epithelial extract. Graph indicates increasing accumulation of GS-DNB conjugate over time, as determined by absorbance at 340nm. Note reduced slope of mutant relative to control. C) Percent of control GST activity from three separate mutant-control epithelial pairs.

References

    1. Anthony TE, Mason HA, Gridley T, Fishell G, Heintz N. Brain lipid-binding protein is a direct target of Notch signaling in radial glial cells. Genes Dev. 2005;19:1028–33. - PMC - PubMed
    1. Beatus P, Lundkvist J, Oberg C, Lendahl U. The notch 3 intracellular domain represses notch 1-mediated activation through Hairy/Enhancer of split (HES) promoters. Development. 1999;126:3925–35. - PubMed
    1. Ben-Arie N, Khen M, Lancet D. Glutathione S-transferases in rat olfactory epithelium: purification, molecular properties and odorant biotransformation. Biochem J. 1993;292(Pt 2):379–84. - PMC - PubMed
    1. Berezovska O, Xia MQ, Hyman BT. Notch is expressed in adult brain, is coexpressed with presenilin-1, and is altered in Alzheimer disease. J Neuropathol Exp Neurol. 1998;57:738–45. - PubMed
    1. Bricaud O, Collazo A. The transcription factor six1 inhibits neuronal and promotes hair cell fate in the developing zebrafish (Danio rerio) inner ear. J Neurosci. 2006;26:10438–51. - PMC - PubMed

Publication types

MeSH terms