

Echium oil reduces plasma lipids and hepatic lipogenic gene expression in apoB100-only LDL receptor knockout mice
- PMID: 18155507
- PMCID: PMC2610363
- DOI: 10.1016/j.jnutbio.2007.08.005
Echium oil reduces plasma lipids and hepatic lipogenic gene expression in apoB100-only LDL receptor knockout mice
Abstract
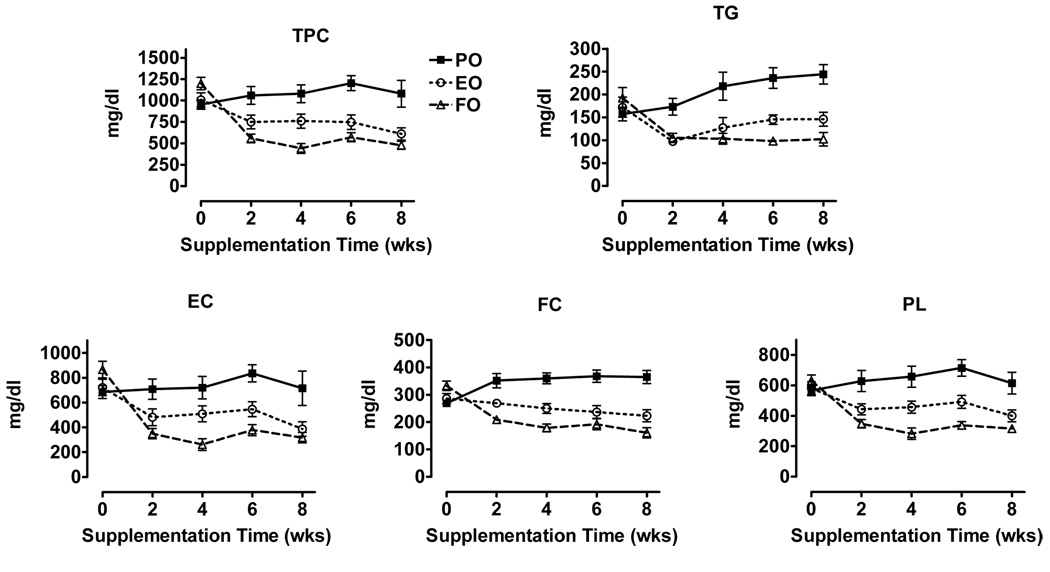
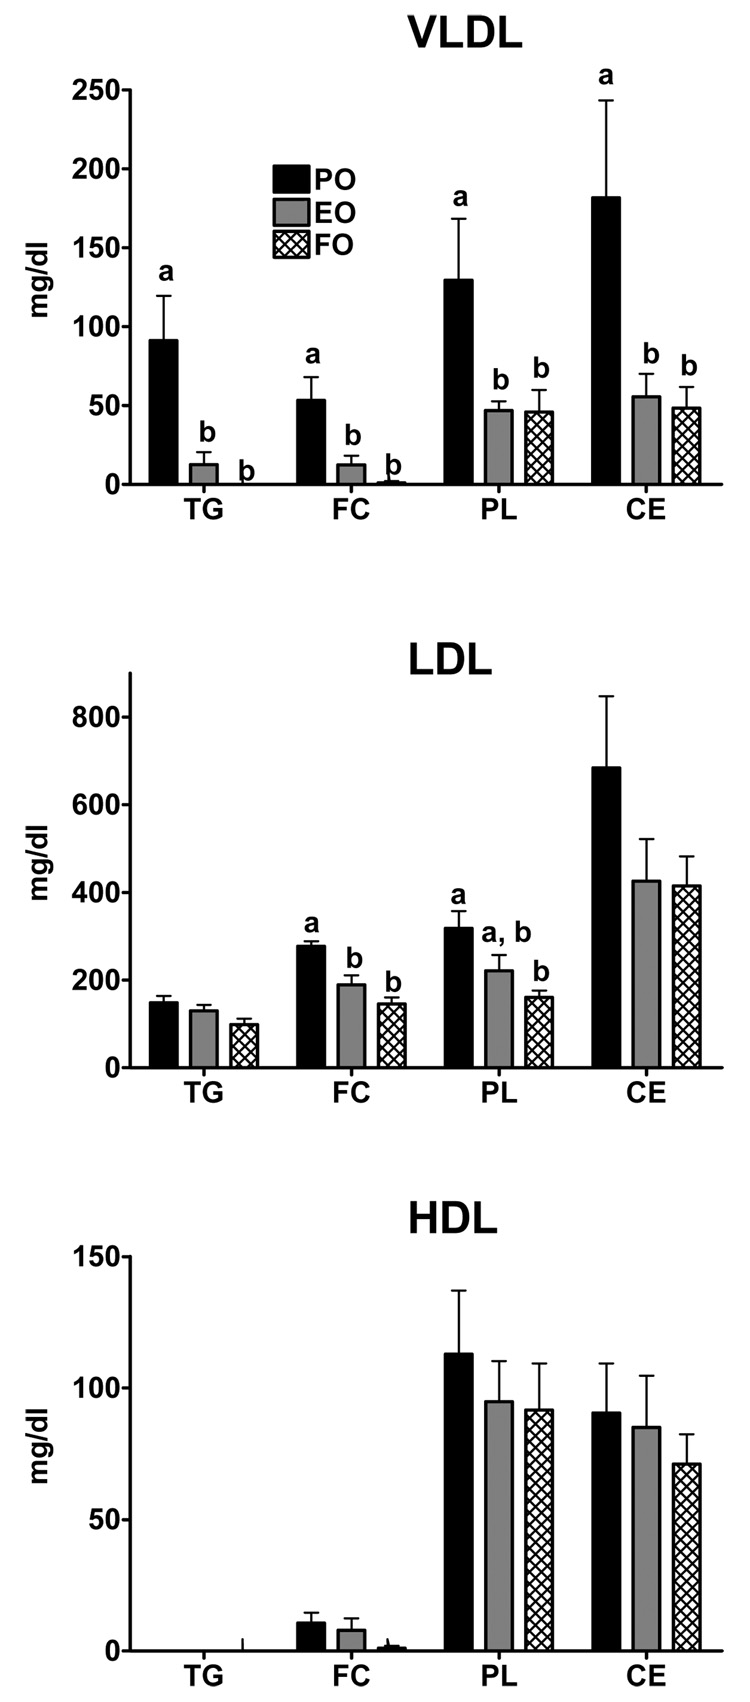
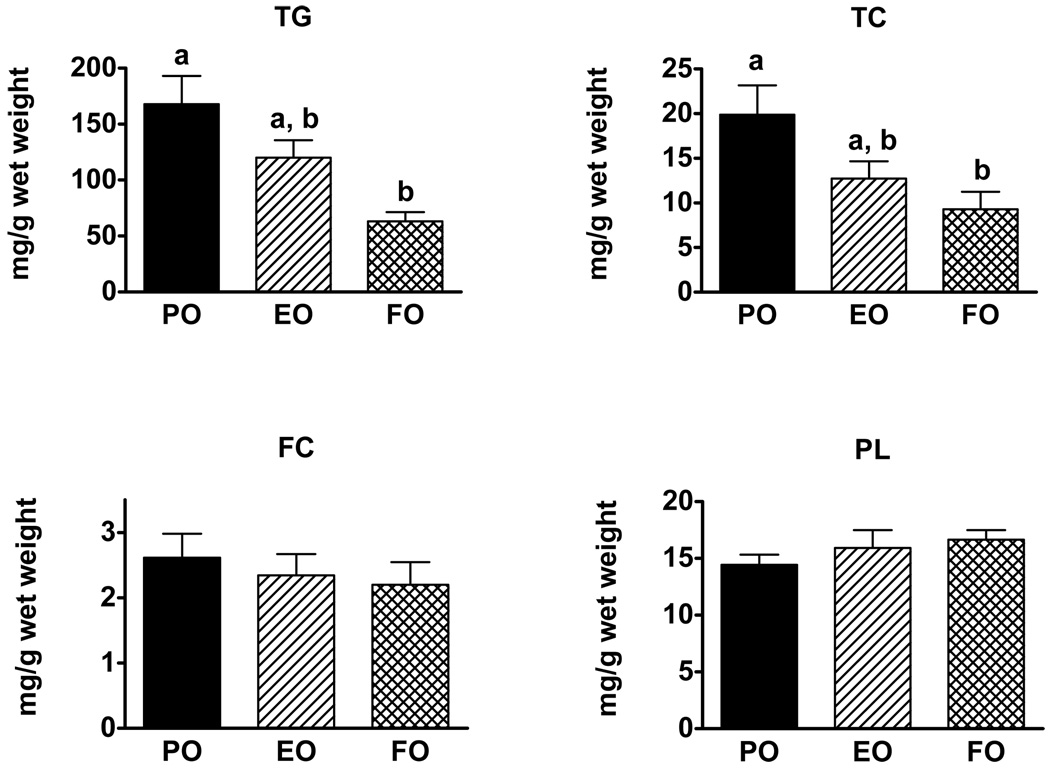
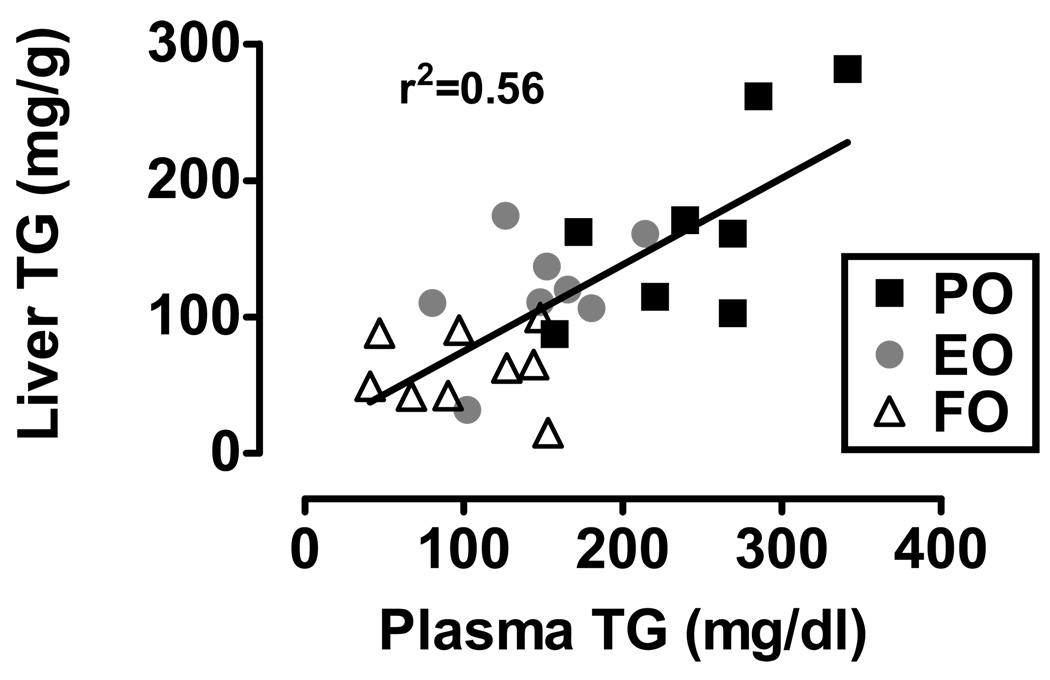
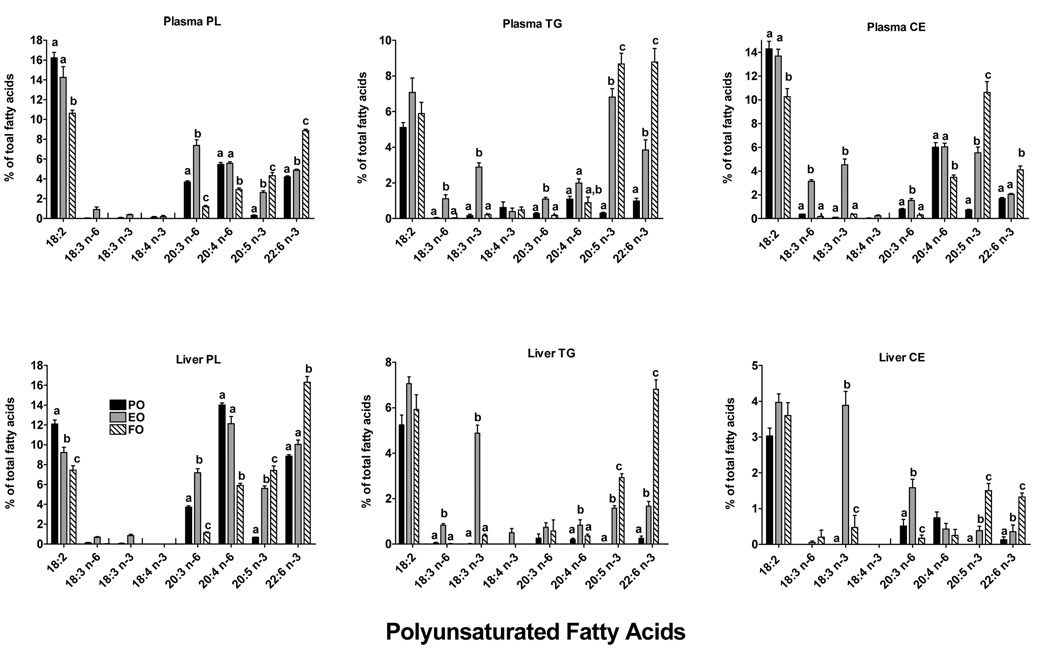
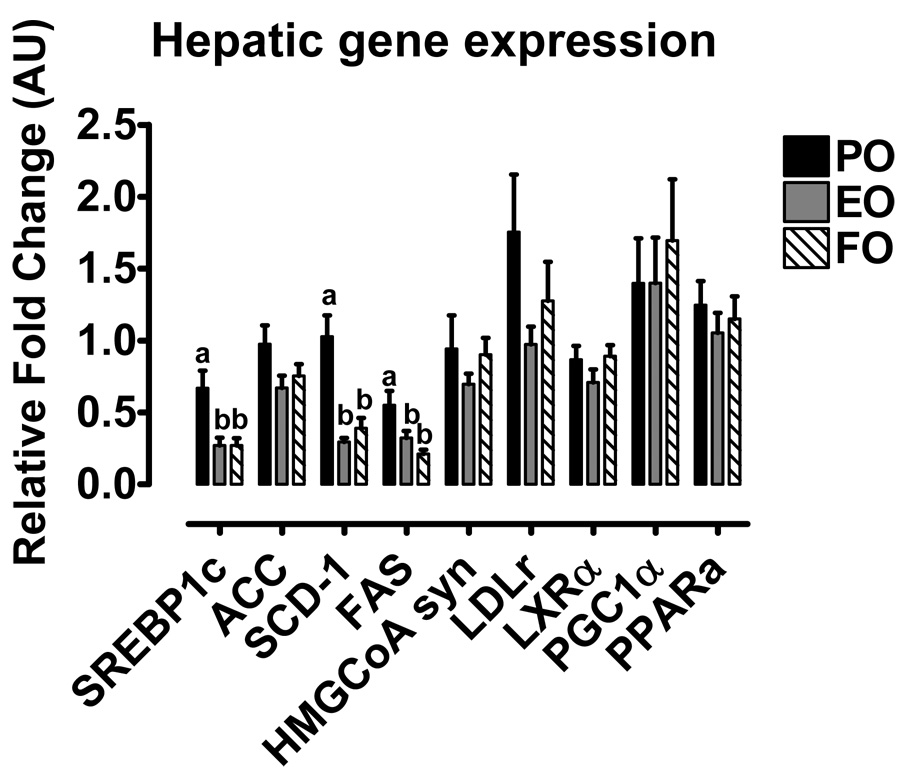
We tested the hypothesis that dietary supplementation with echium oil (EO), which is enriched in stearidonic acid (SDA; 18:4 n-3), the product of Delta-6 desaturation of 18:3 n-3, will decrease plasma triglyceride (TG) concentrations and result in conversion of SDA to eicosapentaenoic acid (EPA) in the liver. Mildly hypertriglyceridemic mice (apoB100-only LDLrKO) were fed a basal diet containing 10% calories as palm oil (PO) and 0.2% cholesterol for 4 weeks, after which they were randomly assigned to experimental diets consisting of the basal diet plus supplementation of 10% of calories as PO, EO or fish oil (FO) for 8 weeks. The EO and FO experimental diets decreased plasma TG and VLDL lipid concentration, and hepatic TG content compared to PO, and there was a significant correlation between hepatic TG content and plasma TG concentration among diet groups. EO fed mice had plasma and liver lipid EPA enrichment that was greater than PO-fed mice but less than FO-fed mice. Down-regulation of several genes involved in hepatic TG biosynthesis was similar for mice fed EO and FO and significantly lower compared to those fed PO. In conclusion, EO may provide a botanical alternative to FO for reduction of plasma TG concentrations.
Figures
Similar articles
-
Echium oil reduces plasma triglycerides by increasing intravascular lipolysis in apoB100-only low density lipoprotein (LDL) receptor knockout mice.Nutrients. 2013 Jul 12;5(7):2629-45. doi: 10.3390/nu5072629. Nutrients. 2013. PMID: 23857172 Free PMC article.
-
Botanical oils enriched in n-6 and n-3 FADS2 products are equally effective in preventing atherosclerosis and fatty liver.J Lipid Res. 2015 Jun;56(6):1191-205. doi: 10.1194/jlr.M059170. Epub 2015 Apr 28. J Lipid Res. 2015. PMID: 25921305 Free PMC article.
-
Echium oil reduces atherosclerosis in apoB100-only LDLrKO mice.Atherosclerosis. 2012 Jan;220(1):118-21. doi: 10.1016/j.atherosclerosis.2011.10.025. Epub 2011 Oct 29. Atherosclerosis. 2012. PMID: 22100249 Free PMC article.
-
Consumption of echium oil increases EPA and DPA in blood fractions more efficiently compared to linseed oil in humans.Lipids Health Dis. 2016 Feb 18;15:32. doi: 10.1186/s12944-016-0199-2. Lipids Health Dis. 2016. PMID: 26892399 Free PMC article. Clinical Trial.
-
Effect of Echium oil compared with marine oils on lipid profile and inhibition of hepatic steatosis in LDLr knockout mice.Lipids Health Dis. 2013 Mar 19;12:38. doi: 10.1186/1476-511X-12-38. Lipids Health Dis. 2013. PMID: 23510369 Free PMC article.
Cited by
-
Recent progress in understanding protein and lipid factors affecting hepatic VLDL assembly and secretion.Nutr Metab (Lond). 2010 Apr 27;7:35. doi: 10.1186/1743-7075-7-35. Nutr Metab (Lond). 2010. PMID: 20423497 Free PMC article.
-
Effect of stearidonic acid-enriched soybean oil on fatty acid profile and metabolic parameters in lean and obese Zucker rats.Lipids Health Dis. 2013 Oct 19;12:147. doi: 10.1186/1476-511X-12-147. Lipids Health Dis. 2013. PMID: 24139088 Free PMC article.
-
Stearidonic and γ-linolenic acids in echium oil improves glucose disposal in insulin resistant monkeys.Prostaglandins Leukot Essent Fatty Acids. 2013 Jul;89(1):39-45. doi: 10.1016/j.plefa.2013.04.003. Epub 2013 May 7. Prostaglandins Leukot Essent Fatty Acids. 2013. PMID: 23664597 Free PMC article.
-
Omega-3 fatty acids ameliorate atherosclerosis by favorably altering monocyte subsets and limiting monocyte recruitment to aortic lesions.Arterioscler Thromb Vasc Biol. 2012 Sep;32(9):2122-30. doi: 10.1161/ATVBAHA.112.253435. Epub 2012 Jul 19. Arterioscler Thromb Vasc Biol. 2012. PMID: 22814747 Free PMC article.
-
Rise in DPA Following SDA-Rich Dietary Echium Oil Less Effective in Affording Anti-Arrhythmic Actions Compared to High DHA Levels Achieved with Fish Oil in Sprague-Dawley Rats.Nutrients. 2016 Jan 4;8(1):14. doi: 10.3390/nu8010014. Nutrients. 2016. PMID: 26742064 Free PMC article.
References
-
- Yusuf S, Hawken S, Ounpuu S, Dans T, Avezum A, Lanas F, et al. Effect of potentially modifiable risk factors associated with myocardial infarction in 52 countries (the INTERHEART study): case-control study. Lancet. 2004;364:937–952. - PubMed
-
- Cullen P. Evidence that triglycerides are an independent coronary heart disease risk factor. Am J Cardiol. 2000;86:943–949. - PubMed
-
- Dyerberg J, Bang HO. A hypothesis on the development of acute myocardial in-farction in Greenlanders. Scand J Clin Lab Invest Suppl. 1982;161:7–13. - PubMed
-
- McLennan PL, Abeywardena MY, Charnock JS. Dietary fish oil prevents ventricular fibrillation following coronary artery occlusion and reperfusion. Am Heart J. 1988;116:709–717. - PubMed
Publication types
MeSH terms
Substances
Grants and funding
LinkOut - more resources
Full Text Sources
Other Literature Sources
Research Materials
Miscellaneous
