. 2008 Feb 6;151(3):868-87.
doi: 10.1016/j.neuroscience.2007.11.008. Epub 2007 Nov 17.

Encoding of temporal features of auditory stimuli in the medial nucleus of the trapezoid body and superior paraolivary nucleus of the rat

Affiliations

Encoding of temporal features of auditory stimuli in the medial nucleus of the trapezoid body and superior paraolivary nucleus of the rat

A Kadner et al. Neuroscience. .

Abstract

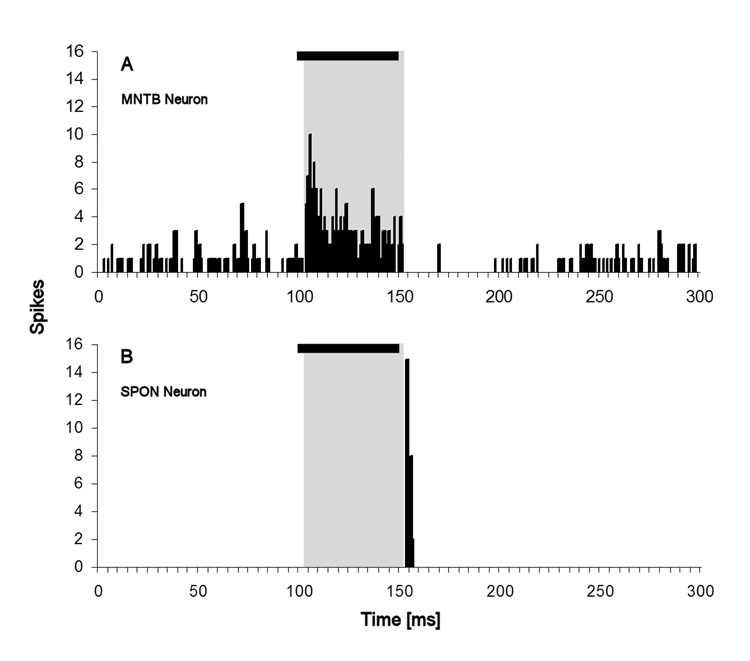
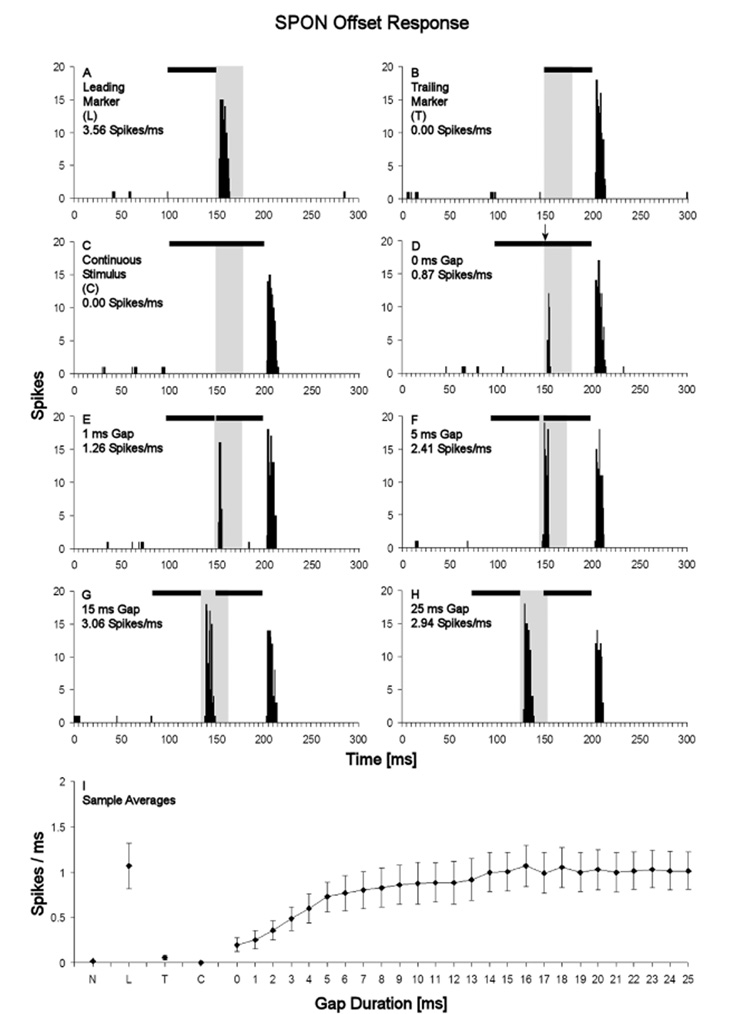
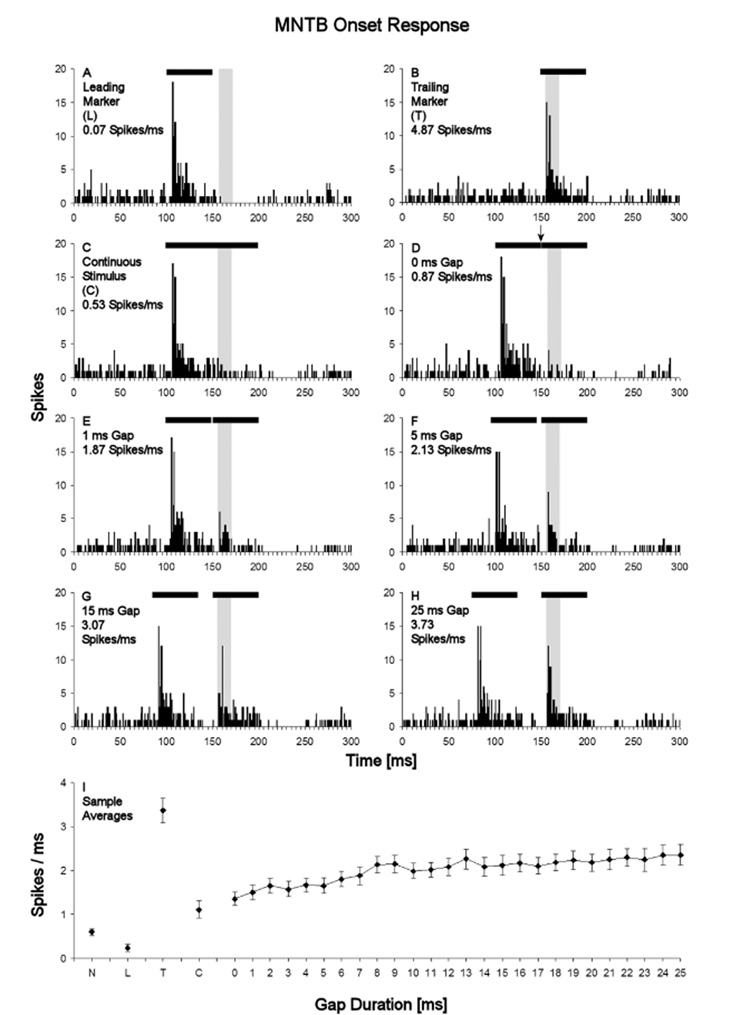
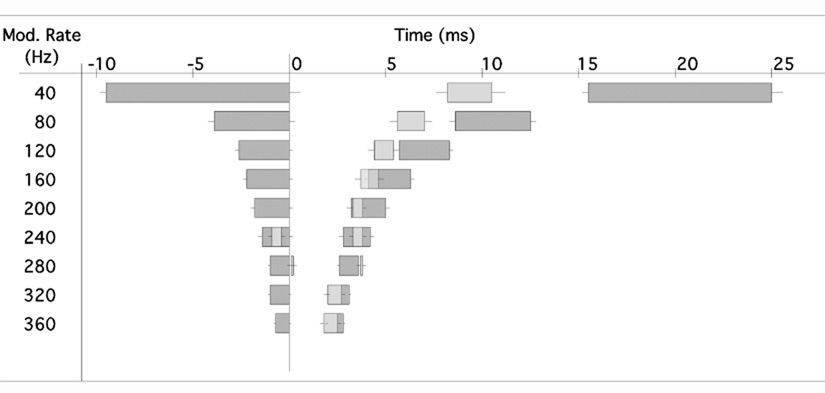
Neurons in the superior paraolivary nucleus (SPON) of the rat respond to the offset of pure tones with a brief burst of spikes. Medial nucleus of the trapezoid body (MNTB) neurons, which inhibit the SPON, produce a sustained pure tone response followed by an offset response characterized by a period of suppressed spontaneous activity. This MNTB offset response is duration dependent and critical to the formation of SPON offset spikes [Kadner A, Kulesza RJ Jr, Berrebi AS (2006) Neurons in the medial nucleus of the trapezoid body and superior paraolivary nucleus of the rat may play a role in sound duration coding. J Neurophysiol. 95:1499-1508; Kulesza RJ Jr, Kadner A, Berrebi AS (2007) Distinct roles for glycine and GABA in shaping the response properties of neurons in the superior paraolivary nucleus of the rat. J Neurophysiol 97:1610-1620]. Here we examine the temporal resolution of the rat's MNTB/SPON circuit by assessing its capability to i) detect gaps in tones, and ii) synchronize to sinusoidally amplitude modulated (SAM) tones. Gap detection was tested by presenting two identical pure tone markers interrupted by gaps ranging from 0 to 25 ms duration. SPON neurons responded to the offset of the leading marker even when the two markers were separated only by their ramps (i.e. a 0 ms gap); longer gap durations elicited progressively larger responses. MNTB neurons produced an offset response at gap durations of 2 ms or longer, with a subset of neurons responding to 0 ms gaps. SAM tone stimuli used the unit's characteristic frequency as a carrier, and modulation rates ranged from 40 to 1160 Hz. MNTB neurons synchronized to modulation rates up to approximately 1 kHz, whereas spiking of SPON neurons decreased sharply at modulation rates >or=400 Hz. Modulation transfer functions based on spike count were all-pass for MNTB neurons and low-pass for SPON neurons; the modulation transfer functions based on vector strength were low-pass for both nuclei, with a steeper cutoff for SPON neurons. Thus, the MNTB/SPON circuit encodes episodes of low stimulus energy, such as gaps in pure tones and troughs in amplitude modulated tones. The output of this circuit consists of brief SPON spiking episodes; their potential effects on the auditory midbrain and forebrain are discussed.


Figures

Fig. 1
Fig. 1. PSTHs display typical response characteristics of MNTB and SPON neurons to CF tones
A: MNTB units display high rates of spontaneous activity, and in response to CF tones (20 dB above threshold) display prominent onset and sustained firing during the stimulus presentation. Note the suppression of spontaneous rate following the termination of the stimulus. B: SPON units have little or no spontaneous activity; in response to CF tones they discharge briefly at the stimulus offset. The black bar at the top of each panel represents the stimulus. The gray shading in both panels denotes the time interval of the excitatory component of the MNTB response.
Fig. 2
Fig. 2. Localization of superior paraolivary nucleus (SPON) and medial nucleus of the trapezoid body (MNTB) recording sites
A: Transverse sections of the brainstem were counterstained with neutral red to facilitate accurate identification of the boundaries of superior olivary nuclei. B: Higher magnification photomicrograph reveals small biocytin deposit in SPON (arrow). In most cases, such deposits caused the retrograde labeling of neighboring neurons in SPON, as well as neurons in MNTB neurons that project to the injection site (lower right corner). C: Photomicrograph of a recorded MNTB neuron labeled by biocytin deposit. D: dorsal; M, medial; LNTB, lateral nucleus of the trapezoid body; LSO, lateral superior olive; MSO, medial superior olive; tb, midline trapezoid body; VNTB, ventral nucleus of the trapezoid body.
Fig. 3
Fig. 3. Timing of MNTB response components and gap detection analysis windows
A: Response of an MNTB neuron in the leading marker only condition. The black bar at the top of the diagram represents the stimulus. The light gray shaded areas represent the first spike latency (FSL) and continued excitation (CE), in this example 4 and 3 ms, respectively; the dark gray shading marks the MNTB offset response duration (ORD) (43 ms in this example). B: Response of the same MNTB neuron to leading and trailing markers (black bars) separated by a 10 ms gap. The continued excitation (CE) to the leading marker and the first spike latency (FSL) of the response to the trailing marker are denoted by dotted vertical lines; these parameters were used to define the temporal analysis window for the MNTB offset response to the leading marker (shaded in light gray). The analysis window in this example started at 143 ms and ended at 154 ms.
Fig. 4
Fig. 4. Characteristic frequencies and thresholds of recorded MNTB and SPON neurons
We recorded from a total of 52 MNTB units (×) and 35 SPON units (Δ). The MNTB sample displayed CFs ranging from 2.1-56 kHz and thresholds ranging from 6.5-79 dB SPL. The SPON sample displayed CFs ranging from 0.9-50 kHz and thresholds ranging from 8.5-77 dB SPL. On average, thresholds of MNTB units were 17.3 dB lower than those of SPON units.
Fig. 5
Fig. 5. Gap sensitivity of the SPON offset response to the leading gap marker
Peri-stimulus time histograms show the responses of an SPON neuron in the leading marker only condition (A), the trailing marker only condition (B), and the continuous stimulus control condition (C). D–H: Responses of this neuron to gaps of 0, 1, 5, 15 and 25 ms duration, respectively. Black bars at the top of the each PSTH denotes the stimulus; the arrow above the bar in panel D marks the point at which the leading marker ends and the trailing marker begins. The analysis window used for quantifying the neuron’s offset responses to the leading marker are shaded in gray. I: Sample averages of the magnitude of SPON offset responses to the leading marker plotted over gap duration. Note that response magnitudes in panels A–H are given as rates, expressed in spikes/ms. Error bars represent standard errors of the means. Abbreviations on the horizontal axis are: N, no stimulation condition; L, leading marker only condition; T, trailing marker only condition; C, continuous stimulus control condition.
Fig. 6
Fig. 6. Gap sensitivity of the MNTB offset response to the leading gap marker
Peri-stimulus time histograms show the responses of an MNTB neuron in the no stimulation condition (A) from which its spontaneous rate was determined, the leading marker only condition (B), and the continuous stimulus condition (C). D–H: Responses of this neuron to gaps of 0, 1, 5, 15 and 25 ms duration, respectively. Black bars at the top of each PSTH denotes the stimulus; the arrow above the bar in panel D marks the point at which the leading marker ends and the trailing marker begins. The analysis window used for quantifying the neuron’s offset responses to the leading marker are shaded in gray. I: Sample averages of the magnitude of MNTB offset responses to the leading marker plotted over gap duration. The dashed horizontal line indicates the sample’s average rate of spontaneous activity. Note that response magnitudes in panels A–H are given as rates, expressed in spikes/ms. Error bars represent standard errors of the means. Other abbreviations are as in Figure 3.
Fig. 7
Fig. 7. Gap sensitivity of the MNTB onset response to the trailing marker
Peristimulus time histograms show the responses of the same MNTB neuron as in Figure 4, in the leading marker only condition (A), the trailing marker only condition (B), and the continuous stimulus control condition (C). D–H: Responses of this neuron to gaps of 0, 1, 5, 15 and 25 ms duration, respectively. Black bars at the top of each PSTH denotes the stimulus, and the arrow above the bar in panel D marks the point at which the leading marker ends and the trailing marker begins. The analysis window used for quantifying the neuron’s onset responses to the trailing marker are shaded in gray. I: Sample averages of the magnitude of MNTB onset responses to the trailing marker plotted over gap duration. Note that response magnitudes in panels A–H are given as rates, expressed in spikes/ms. Error bars represent standard errors of the mean. Other abbreviations are as in Figure 4.
Fig. 8
Fig. 8. Typical responses of an MNTB neuron to sinusoidally amplitude modulated tones
Left panels show PSTHs of responses to sinusoidally amplitude modulated tones; the analysis windows are shaded in gray. Right panels show period histograms generated from the spikes contained in the analysis window. MR, modulation rate; r, vector strength; p, p-value from the Rayleigh-test.
Fig. 9
Fig. 9. Typical responses of an SPON neuron to sinusoidally amplitude modulated tones
Left panels show PSTHs of responses to sinusoidally amplitude modulated tones; the analysis windows are shaded in grey. Right panels show period histograms generated from the spikes contained in the analysis window. MR, modulation rate; r, vector strength; p, p-value from the Rayleigh test.
Fig. 10
Fig. 10. Response properties of MNTB and SPON neurons as a function of modulation rate
A: Percentage of neurons demonstrating phase locking to SAM stimuli, as indicated by a significant result of the Rayleigh test, as a function of modulation rate. B: Mean number of spikes per presentation as a function of modulation rate. C: Mean vector strength as a function of modulation rate. Error bars in B and C represent the standard errors of the means.
Fig. 11
Fig. 11. Relative timing of MNTB and SPON spiking in response to amplitude modulated tones
In order to show the temporal relationship between spiking episodes in the MNTB and SPON, the end of MNTB spiking was plotted as the beginning of the cycle (see results section). The average timing of MNTB spiking episodes (dark bars) and SPON spiking episodes (light bars) during one full modulation cycle of the stimulus is shown on the right side of the diagram, with positive time values. All events following the onset of MNTB spiking are also shown on the left side of the diagram with negative time values, representing the preceding phase. Whiskers represent the standard errors of the means.
Fig. 12
Fig. 12. In response to amplitude modulated tones, SPON latency shifts are dependent on discharges to previous modulation cycles
Latencies of SPON unit responses to individual modulation cycles of SAM tones were grouped according to the number of modulation cycles that had elapsed since the neurons’ last preceding spike, and plotted relative to the timing of reference spikes (those evoked by the first response to the stimulus and those preceded by an interspike interval of > 50 ms; see text). At MRs between 40 and 160 Hz, latencies were increased when the preceding modulation cycle also evoked a discharge from the unit (i.e., 0 modulation cycles skipped; p < .05 at 40 Hz MR). At modulation rates ≥ 200 Hz, all spikes were preceded by at least one modulation cycle without a discharge. *= p<.05.

References

    1. Adams JC. Cytology of periolivary cells and the organization of their projections in the cat. J. Comp. Neurol. 1983;215:275–289. - PubMed
    1. Allen PD, Burkard RF, Ison JR, Walton JP. Impaired gap encoding in aged mouse inferior colliculus at moderate but not high stimulus levels. Hear. Res. 2003;186:17–29. - PubMed
    1. Bacci A, Rudolph U, Huguenard JR, Prince DA. Major differences in inhibitory synaptic transmission onto two neocortical interneuron subclasses. J. Neurosci. 2003;23:9664–9674. - PMC - PubMed
    1. Banks MI, Smith PH. Intracellular recordings from neurobiotin-labeled cells in brain slices of the rat medial nucleus of the trapezoid body. J. Neurosci. 1992;12:2819–2837. - PMC - PubMed
    1. Barsz K, Ison JR, Snell KB, Walton JP. Behavioral and neural measures of auditory temporal acuity in aging humans and mice. Neurobiol. Aging. 2002;23:565–578. - PubMed

Publication types