. 2008 Jan;172(1):77-85.
doi: 10.2353/ajpath.2008.070640. Epub 2007 Dec 21.

Severe intrauterine growth restriction pregnancies have increased placental endoglin levels: hypoxic regulation via transforming growth factor-beta 3

Affiliations

Severe intrauterine growth restriction pregnancies have increased placental endoglin levels: hypoxic regulation via transforming growth factor-beta 3

Yoav Yinon et al. Am J Pathol. 2008 Jan.

Abstract

Endoglin, a co-receptor for transforming growth factor (TGF)-beta 1 and -beta 3 is expressed in the human placenta and plays an important role in the pathogenesis of preeclampsia. Because preeclampsia is associated with hypoxia, and because TGF-beta 3 is overexpressed in preeclamptic pregnancies, we examined the effect of oxygen and TGF-beta 3 on placental endoglin expression and investigated its expression in pathological models of placental hypoxia such as intrauterine growth restriction (IUGR) pregnancies. Endoglin expression was high at 4 to 9 weeks of gestation, when oxygen tension is low, and decreased after 10 weeks, when oxygen tension increases. Exposure of villous explants to low oxygen (3% O2) resulted in elevated expression of both membrane and soluble endoglin compared to standard conditions (20% O2). Moreover, addition of TGF-beta 3 to villous explants under low oxygen conditions increased the expression of endoglin compared to nontreated explants whereas addition of TGF-beta 3-neutralizing antibodies inhibited the low oxygen stimulatory effect on endoglin expression. Endoglin and soluble endoglin expression were significantly increased in placentas of IUGR singletons compared to controls and in the IUGR twin placentas relative to both the control co-twin and the normal twins. These data demonstrate that oxygen regulates the placental expression of endoglin via TGF-beta 3. Reduced placental perfusion leading to placental hypoxia might contribute to the increased expression of endoglin in IUGR pregnancies.


Figures

Figure 1
Figure 1
Eng expression during placental development. A: Expression of Eng mRNA in early first trimester placental samples versus late first and second trimester and term placental samples as assessed by qRT-PCR (4 to 9 weeks, n = 7; 11 to 19 weeks, n = 6; term, n = 4); *P < 0.01, 4 to 9 weeks versus 11 to 19 weeks and 4 to 9 weeks versus term. B: Representative Western blot analysis for Eng and sEng in first and second trimester placental samples. C: Eng (left) and sEng (right) protein densitometric analysis in placental tissues from early first trimester (4 to 9 weeks, n = 7) compared to late first and second trimester (11 to 19 weeks, n = 7), *P < 0.01.
Figure 2
Figure 2
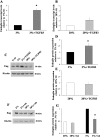
Effect of low oxygen on Eng expression in first trimester villous explants. A: Expression of Eng mRNA in explants cultured at 3%, 8%, and 20% O2 measured by qRT-PCR (n = 6; *P < 0.05, 3% versus 20%). B: Top: Representative Western blot of Eng and sEng shows full-length Eng (90 kDa) and sEng (65 kDa), which are highly expressed in first trimester villous explants exposed to 3% O2 compared to 8% O2 and 20% O2; bottom: representative Western blot of HIF-1α. C: Eng protein densitometric analysis in first trimester villous explants exposed to different oxygen conditions, n = 6. *P < 0.05, 3% versus 20%.
Figure 3
Figure 3
Effect of TGF-β3 on Eng expression in first trimester villous explants exposed to different oxygen conditions. A: Eng mRNA levels in explants cultured at 3% oxygen with and without TGF-β3 as measured by qRT-PCR (n = 3, *P < 0.05). B: Eng mRNA levels in explants cultured at 20% oxygen with and without TGF-β3 as measured by qRT-PCR (n = 3, P = 0.07). C: Representative Western blot of Eng in villous explants with and without TGF-β3 in different oxygen conditions. D: Eng protein densitometric analysis of explants exposed to 3% oxygen with and without TGF-β3 (n = 5, *P < 0.01). E: Eng protein densitometric analysis in explants exposed to 20% oxygen with and without TGF-β3 (n = 5). F: Representative Western blot of Eng in villous explants maintained at 3% and 20% oxygen and treated with neutralizing antibodies to TGF-β3. G: Eng protein densitometric analysis of explants exposed to 3% and 20% oxygen with and without TGF-β3-neutralizing antibodies (n = 5, *P < 0.05).
Figure 4
Figure 4
Eng and sEng expression in placentas of IUGR pregnancies. A: Eng transcript levels in IUGR placentas versus preterm controls (PTC) measured by qRT-PCR (IUGR, n = 11; PTC, n = 10; *P < 0.05). B: Representative Eng and sEng Western blot in placentas of IUGR, preterm controls (PTCs), and term controls (TCs). C: Eng protein densitometric analysis of IUGR placentas (n = 12) compared to PTC (n = 8) and TC (n = 8, *P < 0.05). D: sEng protein densitometric analysis of IUGR placentas (n = 12) compared to PTCs (n = 8) and TCs (n = 8, *P < 0.05).
Figure 5
Figure 5
Eng expression in discordant twins’ placentas. A: Eng mRNA levels in discordant twins (S,: small IUGR twin; L,: large normal co-twin; n = 8) compared to control twins (n = 5), assessed by qRT-PCR (*P < 0.05). B: Eng mRNA levels in dichorionic discordant twins (DC, n = 3) and in monochorionic discordant twins (MC, n = 5) as assessed by qRT-PCR (*P < 0.05). C: Representative Eng and sEng Western blot in placentas of discordant dichorionic and monochorionic twins and of normal control twins. D: Eng protein densitometric analysis in placentas of discordant twins (n = 9) compared to placentas of normal control twins (n = 4, *P < 0.05).
Figure 6
Figure 6
Immunohistochemical staining of Eng in IUGR, discordant twins, and control placentas. A: Term control (TC); preterm control (PTC), and IUGR placentas. Brownish staining represents positive Eng immunostaining. B: Negative control (NC), control twin (C-Twin), monochorionic large twin (MC-LTwin), monochorionic small twin (MC-STwin), dichorionic large twin (DC-LTwin), dichorionic small twin (DC-STwin). Original magnifications, ×100.

References

    1. Cetin I, Foidart JM, Miozzo M, Raun T, Jansson T, Tsatsaris V, Reik W, Cross J, Hauguel-de-Mouzon S, Illsley N, Kingdom J, Huppertz B. Fetal growth restriction: a workshop report. Placenta. 2004;25:753–757. - PubMed
    1. Pollack RN, Divon MY. Intrauterine growth retardation: definition, classification, and etiology. Clin Obstet Gynecol. 1992;35:99–107. - PubMed
    1. Krebs C, Macara LM, Leiser R, Bowman AW, Greer IA, Kingdom JC. Intrauterine growth restriction with absent end-diastolic flow velocity in the umbilical artery is associated with maldevelopment of the placental terminal villous tree. Am J Obstet Gynecol. 1996;175:1534–1542. - PubMed
    1. Roh CR, Budhraja V, Kim HS, Nelson DM, Sadovsky Y. Microarray-based identification of differentially expressed genes in hypoxic term human trophoblasts and in placental villi of pregnancies with growth restricted fetuses. Placenta. 2005;26:319–328. - PubMed
    1. McCarthy C, Cotter FE, McElwaine S, Twomey A, Mooney EE, Ryan F, Vaughan J. Altered gene expression patterns in intrauterine growth restriction: potential role of hypoxia. Am J Obstet Gynecol. 2007;196:70.e1–e6. - PubMed

Publication types