. 2008 Apr;190(8):2767-76.
doi: 10.1128/JB.01581-07. Epub 2007 Dec 21.

In situ growth rates and biofilm development of Pseudomonas aeruginosa populations in chronic lung infections

Affiliations

In situ growth rates and biofilm development of Pseudomonas aeruginosa populations in chronic lung infections

Lei Yang et al. J Bacteriol. 2008 Apr.

Abstract

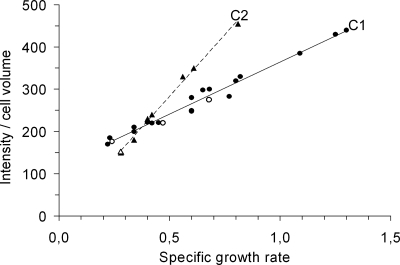
The growth dynamics of bacterial pathogens within infected hosts are a fundamental but poorly understood feature of most infections. We have focused on the in situ distribution and growth characteristics of two prevailing and transmissible Pseudomonas aeruginosa clones that have caused chronic lung infections in cystic fibrosis (CF) patients for more than 20 years. We used fluorescence in situ hybridization (FISH) directly on sputum specimens to examine the spatial distribution of the infecting P. aeruginosa cells. Mucoid variants were present in sputum as cell clusters surrounded by an extracellular matrix, whereas nonmucoid variants were present mainly as dispersed cells. To obtain estimates of the growth rates of P. aeruginosa in CF lungs, we used quantitative FISH to indirectly measure growth rates of bacteria in sputum samples (reflecting the in vivo lung conditions). The concentration of rRNA in bacteria isolated from sputa was measured and correlated with the rRNA contents of the same bacteria growing in vitro at defined rates. The results showed that most cells were actively growing with doubling times of between 100 and 200 min, with some growing even faster. Only a small stationary-phase subpopulation seemed to be present in sputa. This was found for both mucoid and nonmucoid variants despite their different organizations in sputum. The results suggest that the bacterial population may be confronted with selection forces that favor optimized growth activities. This scenario constitutes a new perspective on the adaptation and evolution of P. aeruginosa during chronic infections in CF patients in particular and on long-term infections in general.


Figures

FIG. 1.
FIG. 1.
Distribution of P. aeruginosa populations in CF sputum. Sputum samples either with exclusively nonmucoid variants or with both nonmucoid and mucoid variants from five CF patients were analyzed by CFW staining combined with FISH using a P. aeruginosa-specific rRNA probe. The bar in each photograph represents 15 μm.
FIG. 2.
FIG. 2.
Distribution of P. aeruginosa populations in CF sputum during a course of intravenous antibiotic therapy. Visualization of P. aeruginosa in sputum samples from CF patient p11 obtained before (A), immediately following (B), and 2 months after (C) an intravenous antibiotic therapy course with tobramycin and meropenem is shown. The P. aeruginosa population was visualized directly within sputa by FISH (left column) or by plating (middle column). The genotypes of the infecting clones as well as the frequencies of nonmucoid and mucoid variants for each time point are shown on the right. The bars represent 10 μm.
FIG. 3.
FIG. 3.
Cellular content of ribosomes (fluorescence signal intensity per cell volume) inferred by whole-cell hybridization with a fluorescence-labeled 16S rRNA probe of balanced cultures grown in defined media supporting different specific growth rates. The strains and culture conditions used are described in Materials and Methods. The solid line labeled C1 and the dashed line labeled C2 are regression lines. Bacterial isolates of the b genotype (triangles) display the C2 correlation between ribosome content and specific growth rate (r2 = 0.995). All other isolates tested (circles) display the C1 correlation (r2 = 0.978). Key data points are highlighted by open symbols: anaerobic growth of isolate p7 s1B1/05 of the b genotype is shown by the open triangle, and open circles show growth of the mucoid isolate p11 s3A1/05 of the 4 genotype in minimal medium supplemented with (from left to right) glucose or glucose with Casamino Acids or in LB medium (fastest growth). Each measurement is the average value obtained from the analysis of the fluorescence signal from more than 100 cells. The standard error of the mean was less than 15% for all measurements. Further details related to the data set (strain information, growth media, growth rate, and intensity per cell volume) are provided in the supplemental material.
FIG. 4.
FIG. 4.
Relative fluorescence signal intensity per cell volume during starvation. Exponentially growing cultures of PA14 (triangles), p2 s1F6/05 (squares), and p7 s1B1/05 (circles) in ABT plus 2% Casamino Acids were transferred to ABT medium without a carbon source. At the indicated time points, samples were taken and cellular ribosome content measured by whole-cell hybridization using a fluorescently labeled rRNA probe. The signal intensity measured prior to starvation was set to 100%. Each measurement is the average value obtained from the analysis of the fluorescence signal from more than 100 cells. The standard error of the mean was less than 15% for all measurements.
FIG. 5.
FIG. 5.
Distribution of generation times of P. aeruginosa cells isolated from sputum samples from CF patients p2 (A), p7 (B), and p11 (C). The cellular ribosome contents (fluorescence signal intensity per cell volume) of bacteria in the samples were measured by whole-cell hybridization using a fluorescently labeled rRNA probe. These measurements were converted into apparent doubling times using the appropriate standard correlations presented in Fig. 3.

References

    1. Andersson, D. I., and B. R. Levin. 1999. The biological cost of antibiotic resistance. Curr. Opin. Microbiol. 2489-493. - PubMed
    1. Bagge, N., O. Ciofu, M. Hentzer, J. I. Campbell, M. Givskov, and N. Høiby. 2002. Constitutive high expression of chromosomal beta-lactamase in Pseudomonas aeruginosa caused by a new insertion sequence (IS1669) located in ampD. Antimicrob. Agents Chemother. 463406-3411. - PMC - PubMed
    1. Baltimore, R. S., C. D. Christie, and G. J. Smith. 1989. Immunohistopathologic localization of Pseudomonas aeruginosa in lungs from patients with cystic fibrosis. Implications for the pathogenesis of progressive lung deterioration. Am. Rev. Respir. Dis. 1401650-1661. - PubMed
    1. Barth, A. L., and T. L. Pitt. 1996. The high amino-acid content of sputum from cystic fibrosis patients promotes growth of auxotrophic Pseudomonas aeruginosa. J. Med. Microbiol. 45110-119. - PubMed
    1. Bjorkman, J., D. Hughes, and D. I. Andersson. 1998. Virulence of antibiotic-resistant Salmonella typhimurium. Proc. Natl. Acad. Sci. USA 953949-3953. - PMC - PubMed

Publication types