. 2008 Jan 23;27(2):406-20.
doi: 10.1038/sj.emboj.7601967. Epub 2007 Dec 20.

Dynamic histone H3 methylation during gene induction: HYPB/Setd2 mediates all H3K36 trimethylation

Affiliations

Dynamic histone H3 methylation during gene induction: HYPB/Setd2 mediates all H3K36 trimethylation

John W Edmunds et al. EMBO J. .

Abstract

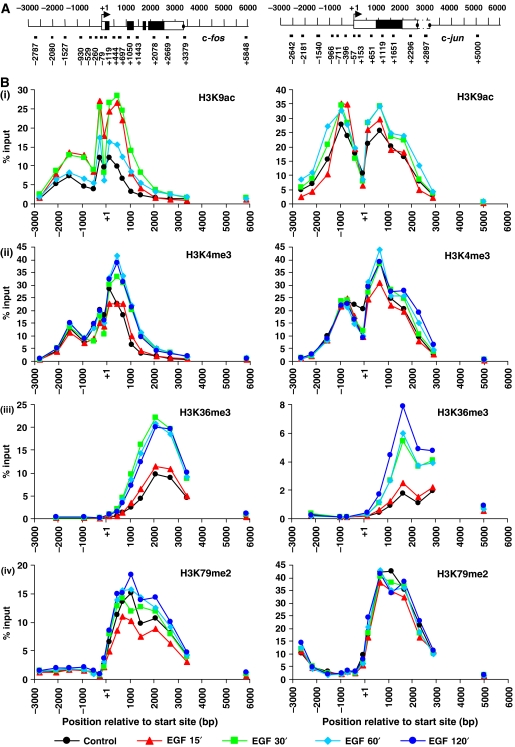
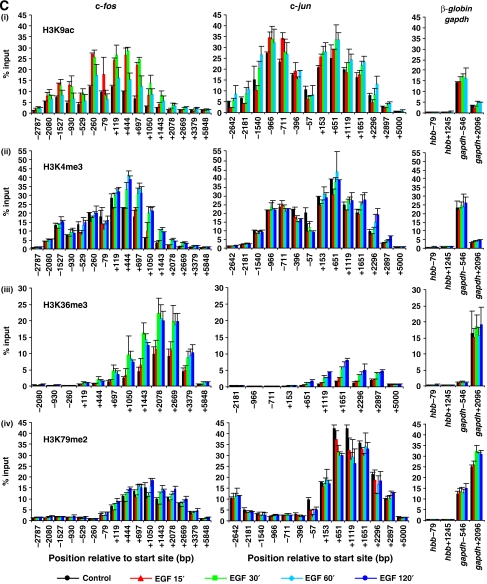
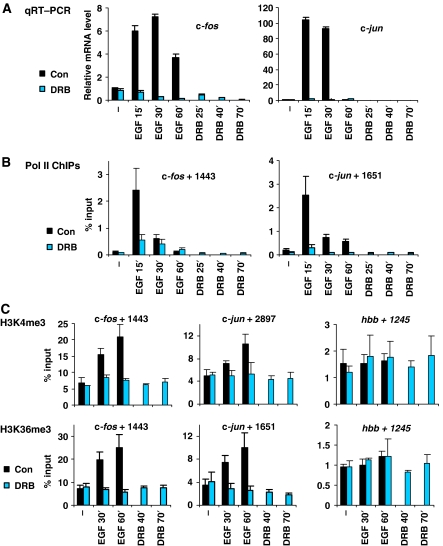
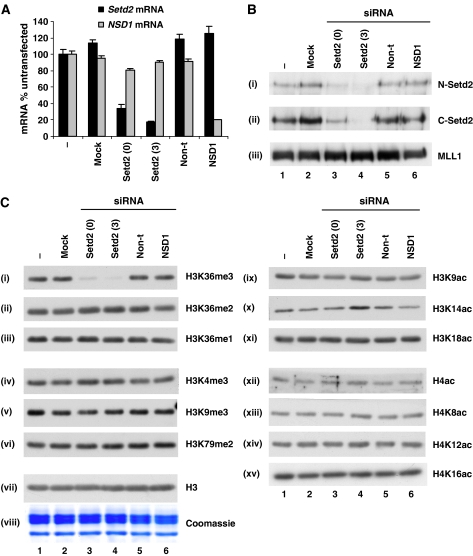
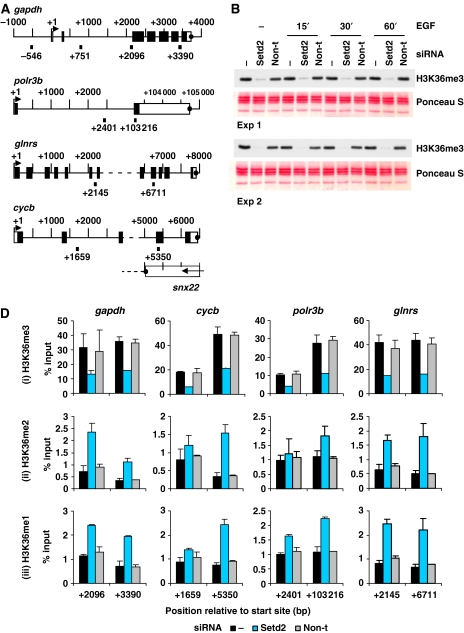
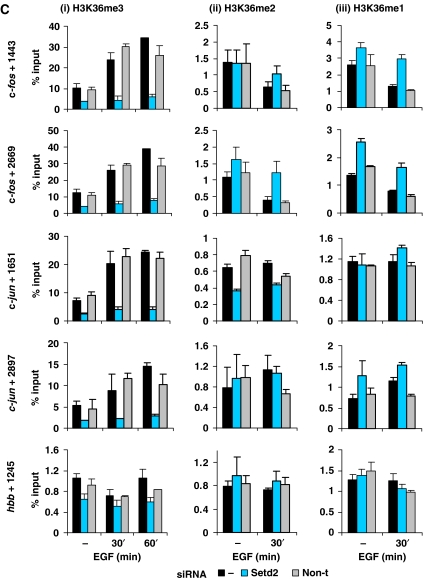
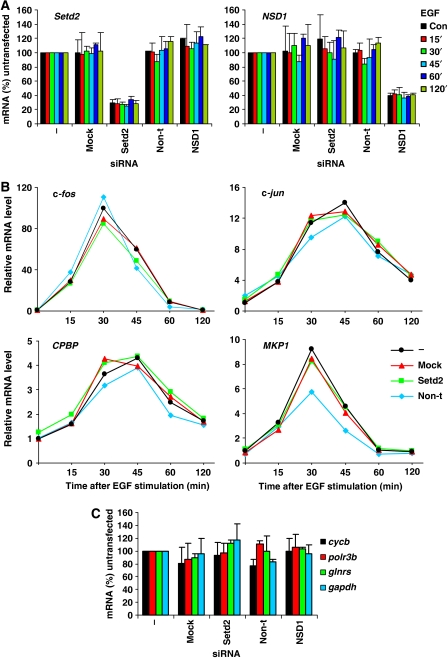
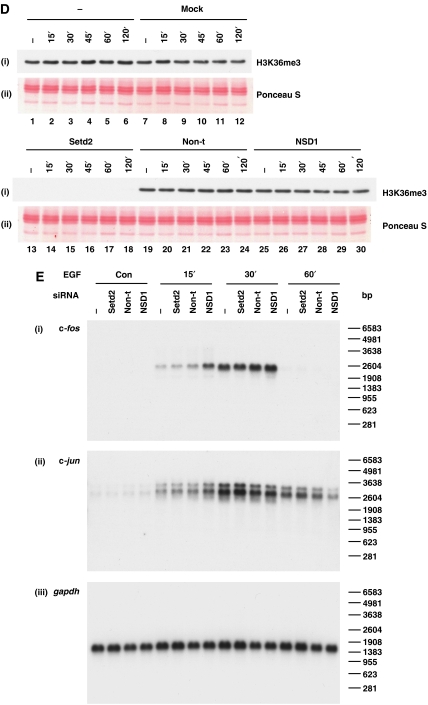
Understanding the function of histone modifications across inducible genes in mammalian cells requires quantitative, comparative analysis of their fate during gene activation and identification of enzymes responsible. We produced high-resolution comparative maps of the distribution and dynamics of H3K4me3, H3K36me3, H3K79me2 and H3K9ac across c-fos and c-jun upon gene induction in murine fibroblasts. In unstimulated cells, continuous turnover of H3K9 acetylation occurs on all K4-trimethylated histone H3 tails; distribution of both modifications coincides across promoter and 5' part of the coding region. In contrast, K36- and K79-methylated H3 tails, which are not dynamically acetylated, are restricted to the coding regions of these genes. Upon stimulation, transcription-dependent increases in H3K4 and H3K36 trimethylation are seen across coding regions, peaking at 5' and 3' ends, respectively. Addressing molecular mechanisms involved, we find that Huntingtin-interacting protein HYPB/Setd2 is responsible for virtually all global and transcription-dependent H3K36 trimethylation, but not H3K36-mono- or dimethylation, in these cells. These studies reveal four distinct layers of histone modification across inducible mammalian genes and show that HYPB/Setd2 is responsible for H3K36 trimethylation throughout the mouse nucleus.


Figures

Figure 1
Figure 1
EGF-stimulated distribution of acetylated and methylated histone H3 across c-fos and c-jun. (A) Schematic representation of c-fos and c-jun showing positions analysed by real-time PCR. Primer positions indicate the 5′ position of the forward primer relative to the transcription start site. Exons are represented by boxes, unfilled for untranslated regions and filled for translated regions. Termination sites are shown as filled circles. (B) Quiescent cells were unstimulated (control) or stimulated with EGF (50 ng/ml) for 15, 30, 60 or 120 min and formaldehyde crosslinked mononucleosomes were prepared for ChIP. Aliquots of chromatin were immunoprecipitated with H3K9ac- (i), H3K4me3- (ii), H3K36me3- (iii) or H3K79me2- (iv) specific antibodies. Recovered DNA sequences were quantified by real-time PCR. Average % input recoveries from two independent experiments are plotted.
Figure 1
Figure 1
(C) Data shown for c-fos and c-jun are the same as in (B) but plotted in bar chart format with error bars representing the standard deviation (s.d.) of the mean of the two independent experiments. For each ChIP, primers spanning two regions of the inactive β-globin (hbb) and the constitutively expressed gapdh genes were also analysed (right-hand side graphs) for comparison.
Figure 2
Figure 2
MNase sensitivity across c-fos and c-jun in quiescent and EGF-stimulated mouse cells. Quiescent cells were unstimulated (control) or stimulated with EGF (50 ng/ml) for 15, 30, 60 or 120 min and formaldehyde crosslinked mononucleosomes were prepared. Equivalent amounts of DNA were isolated from each sample (the DNA is from the same (input) chromatin samples used for the ChIP assays shown in Figure 1 and Supplementary Figure S1) and specific sequences were quantified by real-time PCR. MNase sensitivity is expressed as % of amplifiable DNA sequence in the chromatin sample relative to that in an equivalent amount of intact genomic DNA (more digestion within a region is reflected by fewer intact template molecules that are amplifiable by PCR). Average values from two independent experiments are plotted with s.d. Primers spanning two regions of the hbb and gapdh genes were also analysed and the data are included on both graphs for comparison (c-fos upper panel, c-jun lower panel).
Figure 3
Figure 3
EGF-induced increases in H3K4me3 and H3K36me3 within c-fos and c-jun are transcription-dependent. (A) Quiescent cells were pretreated (10 min) with DRB (25 μg/ml) or untreated (con) prior to stimulation with EGF (50 ng/ml) for 15, 30 or 60 min or no-stimulation (−). Quiescent cells were also treated with DRB alone for 25, 40 or 70 min as controls, respectively. Total mRNA was isolated and relative levels of c-fos and c-jun mRNA were quantified by qRT–PCR with normalisation to gapdh mRNA. A representative experiment is shown. Error bars represent the s.d. from triplicate PCRs. (B) Formaldehyde crosslinked mononucleosomes were prepared from quiescent cells treated as in (A) and used for ChIPs with an anti-RNA-polymerase-II (Pol II) antibody. Recovery of c-fos and c-jun coding DNA sequences were quantified by real-time PCR. Average % input recoveries and s.d. from 3–4 independent experiments are plotted. (C) ChIPs and real-time PCR were performed as described in (B) using H3K4me3- (top panel) and H3K36me3- (bottom panel) specific antibodies. Amplicons analysed are indicated above each graph. Average % input recoveries and s.d. from 3–4 independent experiments are plotted.
Figure 4
Figure 4
Setd2 is a non-redundant H3K36-specific trimethyltransferase. (A) Cells were untransfected (−), mock transfected (no siRNA, mock) or transfected with Setd2 (0 and 3, two different siRNAs), NSD1 or non-targeting (non-t) siRNAs. Total mRNA was isolated 24 h later and relative levels of Setd2 and NSD1 mRNA were quantified by qRT–PCR and normalised to gapdh mRNA. A representative experiment is shown. Error bars represent the s.d. from triplicate PCRs. (B) Cells were transfected as in (A) and crude nuclear lysates were prepared 48 h later. Lysates were separated by 8% SDS–PAGE and transferred to PVDF membrane for immunoblotting with two different Setd2 antibodies (N-Setd2 (i) and C-Setd2 (ii)) and an MLL1 antibody (iii) as a control. (C) Crude nuclear lysates were prepared as in (B), separated by 15% SDS–PAGE and either Coomassie-stained (viii) or transferred to PVDF membrane for immunoblotting with various methyl (i–vi) or acetyl (ix–xv) modification-specific histone antibodies, as indicated in the figure. H4ac is an anti-histone H4 pan-acetyl antibody. Unmodified H3 (H3, vii) was used as a loading control.
Figure 5
Figure 5
Setd2 is responsible for H3K36 trimethylation at IE and housekeeping genes. (A) Schematic representation of the gapdh, polr3b, glnrs and cycb housekeeping genes showing regions amplified by primers used for real-time PCR. Primer positions shown indicate 5′ position of the forward primer relative to the transcription start site. Exons are represented by boxes, unfilled for untranslated regions and filled for translated regions. Transcription termination sites are shown as filled circles. (B) Cells were untransfected (−) or transfected with Setd2 or non-targeting (non-t) siRNA. Cells were quiesced 24 h later, and after a further 24 h were unstimulated (−) or stimulated with EGF (50 ng/ml) for 15–60 min. Formaldehyde crosslinked mononucleosomes were prepared and aliquots of each sample were heated to reverse the crosslinks, separated by 15% SDS–PAGE, transferred to PVDF and immunoblotted with an H3K36me3-specific antibody. Membranes were stained with Ponceau S before immunoblotting to verify even loading. (D) Aliquots of formaldehyde crosslinked mononucleosomes from unstimulated cells prepared as in (B) were used in ChIP assays with H3K36me3- (i), H3K36me2- (ii) and H3K36me1- (iii) specific antibodies. Recovery of gapdh, cycb, polr3b and glnrs coding region sequences were quantified by real-time PCR. Average % input recoveries and s.d. from two independent experiments are plotted.
Figure 5
Figure 5
(C) Aliquots of formaldehyde crosslinked mononucleosomes prepared as in (B) were used in ChIP assays with H3K36me3- (i), H3K36me2- (ii) and H3K36me1- (iii) specific antibodies. Recovery of c-fos, c-jun and hbb coding region sequences were quantified by real-time PCR. Average % input recoveries and s.d. from two independent experiments are plotted. Regions analysed are indicated to the left of the panels.
Figure 6
Figure 6
Effects of H3K36me3 knockdown on gene expression levels: lack of intragenic transcription from IE genes or gapdh. (A) C3H 10T½ cells were untransfected (−), mock transfected (no siRNA, mock) or transfected with Setd2, non-targeting (non-t) or NSD1 siRNA. Cells were quiesced 24 h later, and after a further 24 h left untreated (con) or treated with EGF (50 ng/ml) for 15–120 min. Total RNA was isolated and relative levels of Setd2 and NSD1 mRNA were quantified by qRT–PCR and normalised to 18S rRNA. Average values and s.d. from two independent experiments are plotted. (B) Cells were transfected and stimulated and total RNA isolated as in (A). Kinetics of c-fos, c-jun, CPBP and MKP1 gene expression was assessed by qRT–PCR and normalised to 18S rRNA. Average values and s.d. from two independent experiments are plotted. (C) Cells were transfected as in (A), left unstimulated and levels of cycb, polr3b, glnrs and gapdh mRNA quantified by qRT–PCR, with normalisation to 18S rRNA. Average values and s.d. from two independent experiments are plotted.
Figure 6
Figure 6
(D) Cells were transfected and stimulated as in (A) and cellular protein was isolated from the same TRIzol® reagent preparations used for RNA extraction. Protein was separated by 15% SDS–PAGE and transferred to PVDF membrane for immunoblotting with an H3K36me3 (i)-specific antibody. Ponceau S staining of histones was performed to verify even loading (ii). (E) C3H 10T½ cells were untransfected (−) or transfected with Setd2, non-targeting (non-t) or NSD1 siRNA. Cells were quiesced 24 h later, and after a further 24 h left untreated (con) or treated with EGF (50 ng/ml) for 15–60 min. Total mRNA was isolated and northern blotting carried out with 3′ c-fos (i) and 3′ c-jun (ii) probes and a full-length gapdh cDNA probe (iii).

References

    1. Adhvaryu KK, Morris SA, Strahl BD, Selker EU (2005) Methylation of histone H3 lysine 36 is required for normal development in Neurospora crassa. Eukaryot Cell 4: 1455–1464 - PMC - PubMed
    1. Bannister AJ, Schneider R, Myers FA, Thorne AW, Crane-Robinson C, Kouzarides T (2005) Spatial distribution of di- and tri-methyl lysine 36 of histone H3 at active genes. J Biol Chem 280: 17732–17736 - PubMed
    1. Barratt MJ, Hazzalin CA, Cano E, Mahadevan LC (1994) Mitogen-stimulated phosphorylation of histone H3 is targeted to a small hyperacetylation-sensitive fraction. Proc Natl Acad Sci USA 91: 4781–4785 - PMC - PubMed
    1. Barski A, Cuddapah S, Cui K, Roh TY, Schones DE, Wang Z, Wei G, Chepelev I, Zhao K (2007) High-resolution profiling of histone methylations in the human genome. Cell 129: 823–837 - PubMed
    1. Bell O, Wirbelauer C, Hild M, Scharf AN, Schwaiger M, Macalpine DM, Zilbermann F, van Leeuwen F, Bell SP, Imhof A, Garza D, Peters AH, Schübeler D (2007) Localized H3K36 methylation states define histone H4K16 acetylation during transcriptional elongation in Drosophila. EMBO J (advance online publication, 15 November 2007, doi:10.1038/sj.emboj.7601926) - PMC - PubMed

Publication types

MeSH terms