. 2008 Feb;10(2):186-93.
doi: 10.1038/ncb1679. Epub 2007 Dec 23.

A beta-catenin gradient links the clock and wavefront systems in mouse embryo segmentation

Affiliations

A beta-catenin gradient links the clock and wavefront systems in mouse embryo segmentation

Alexander Aulehla et al. Nat Cell Biol. 2008 Feb.

Abstract

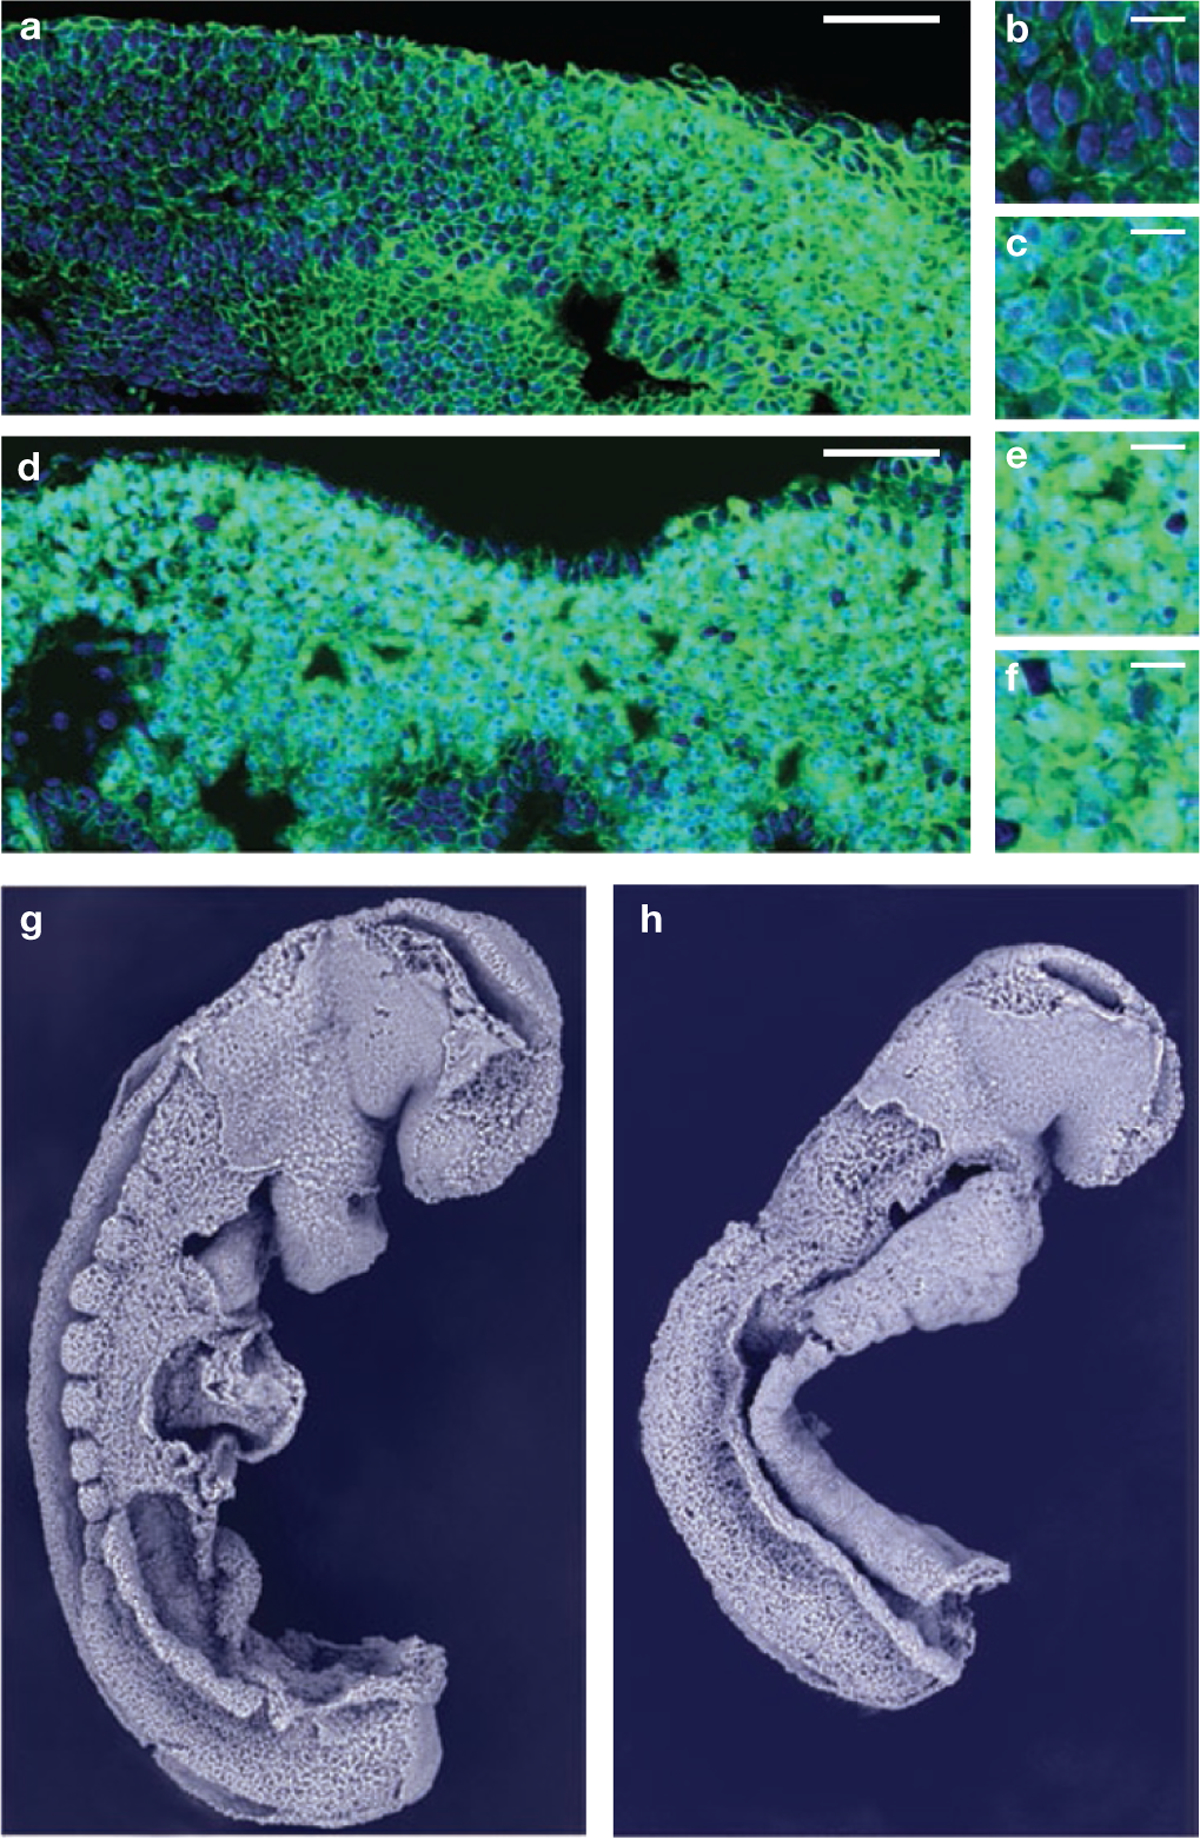
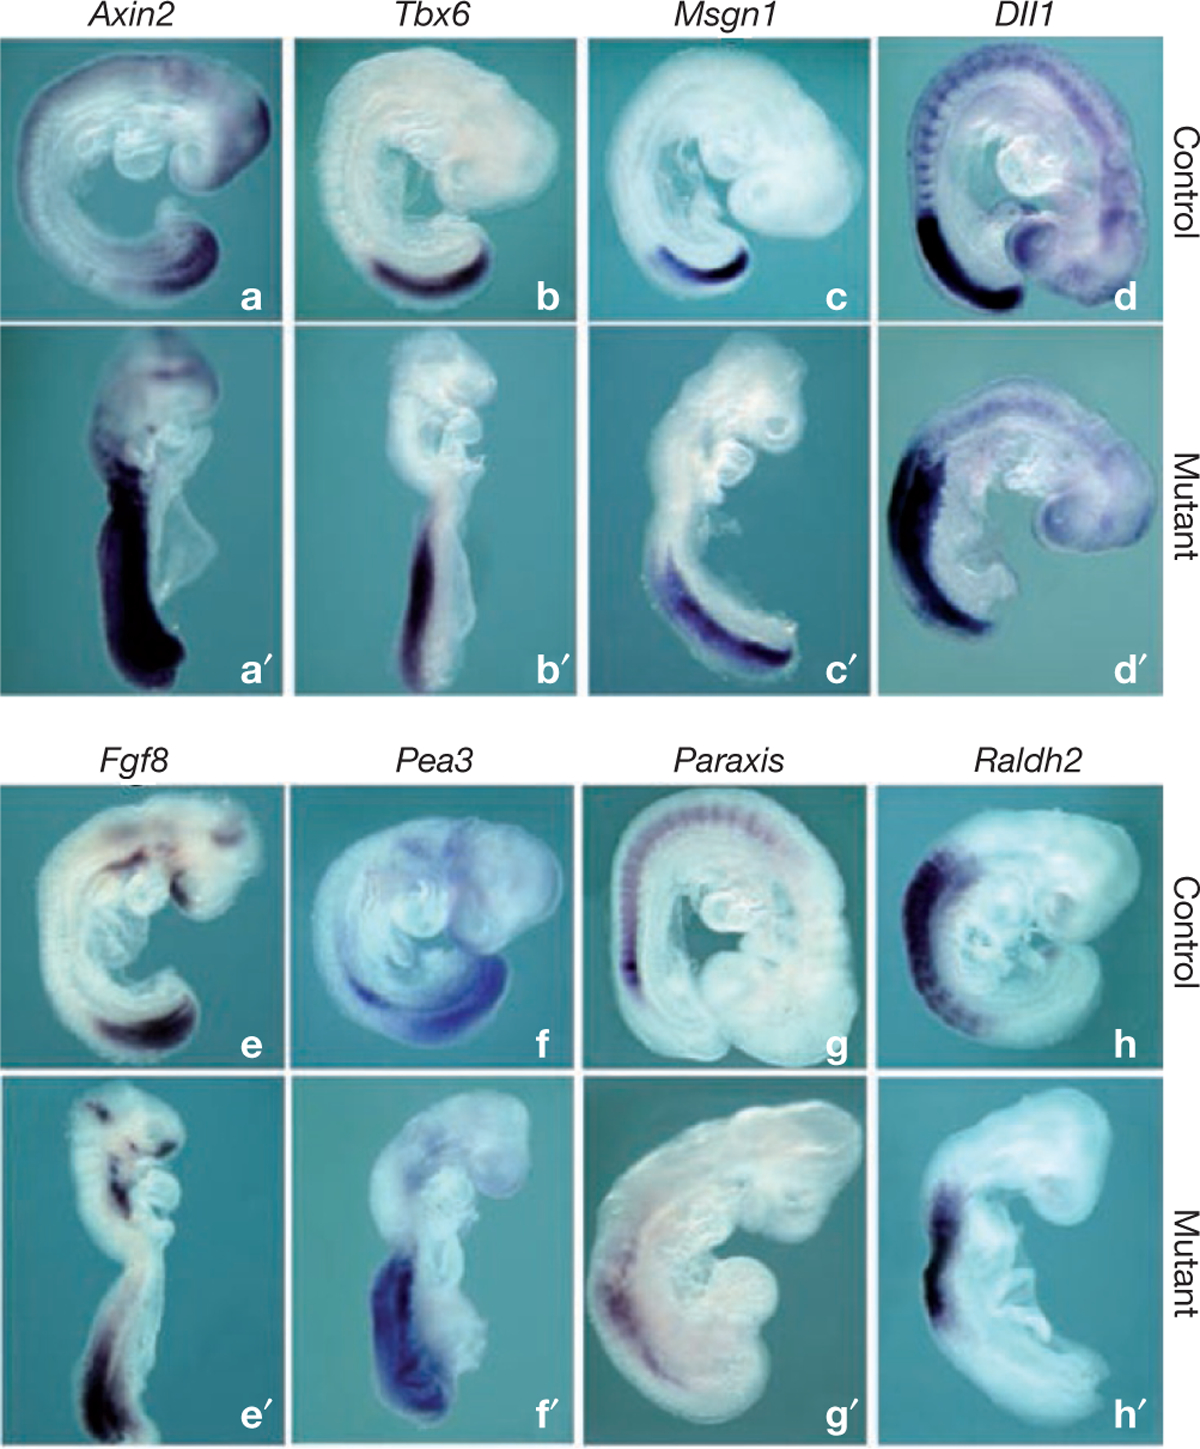
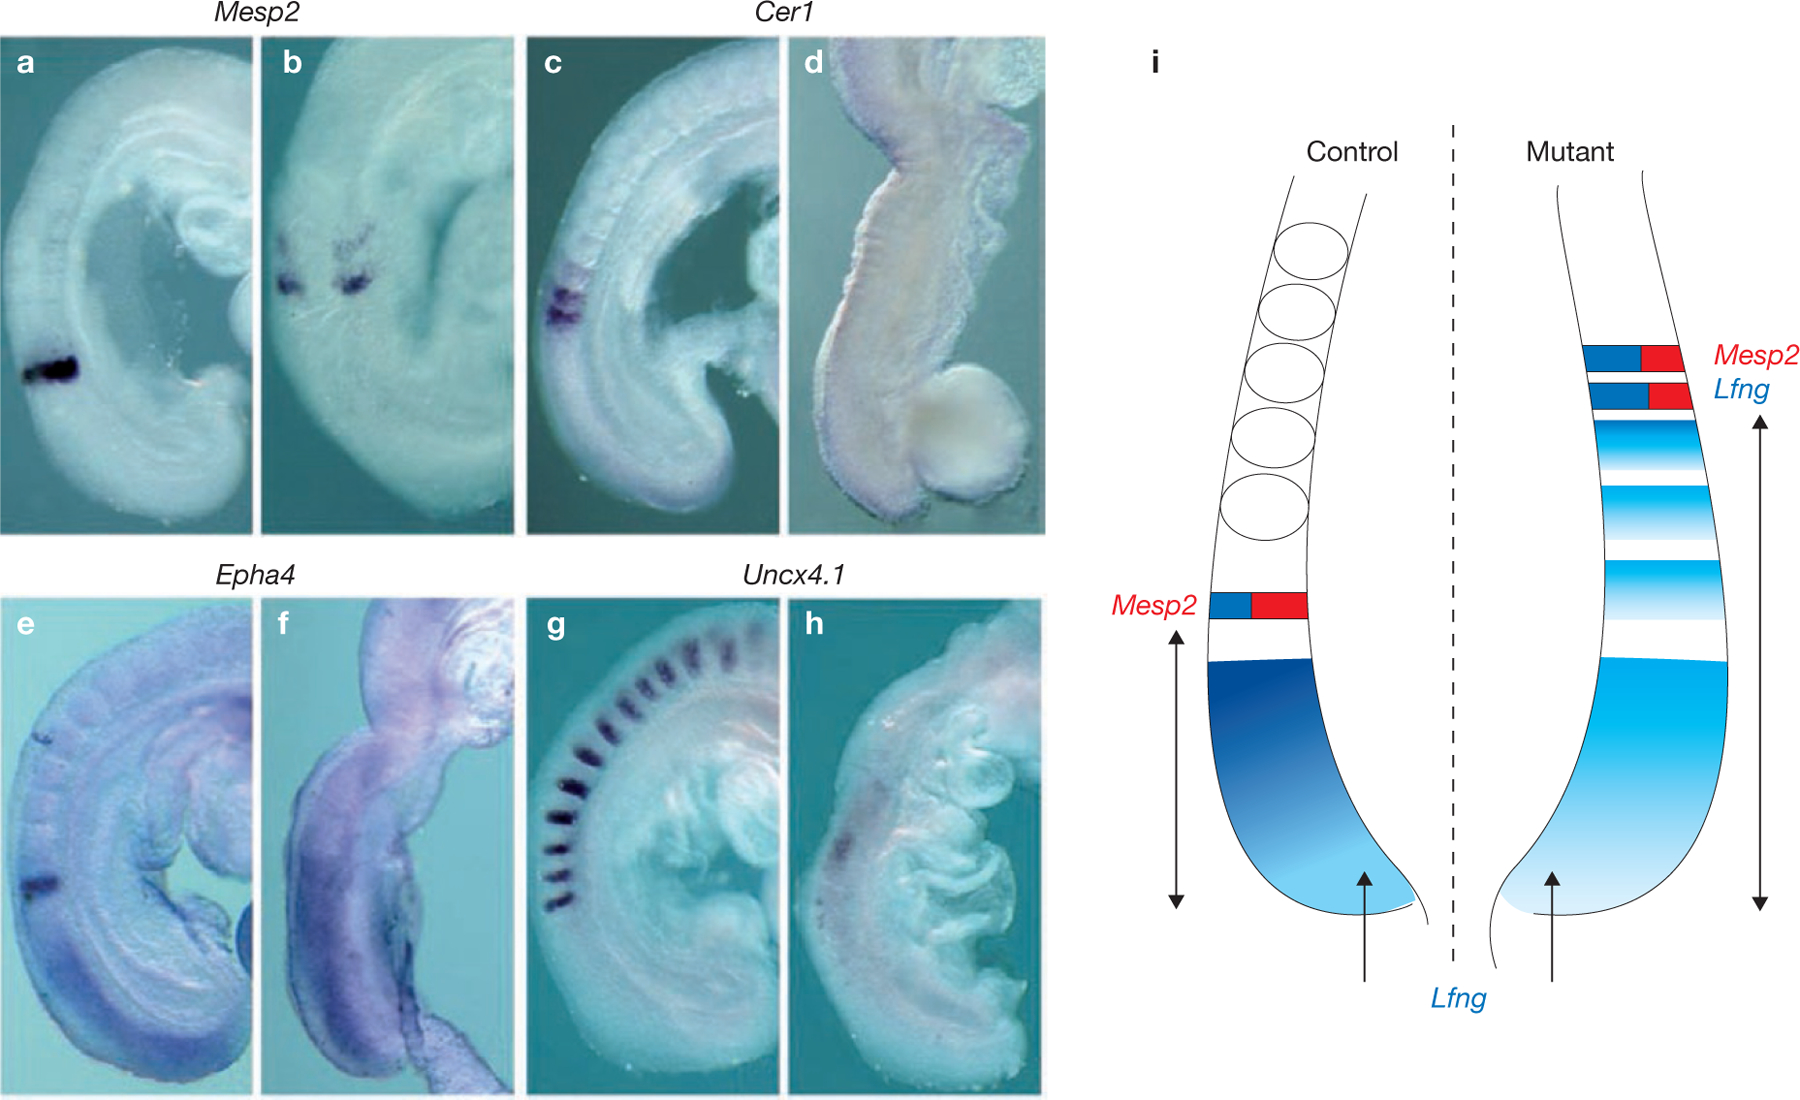
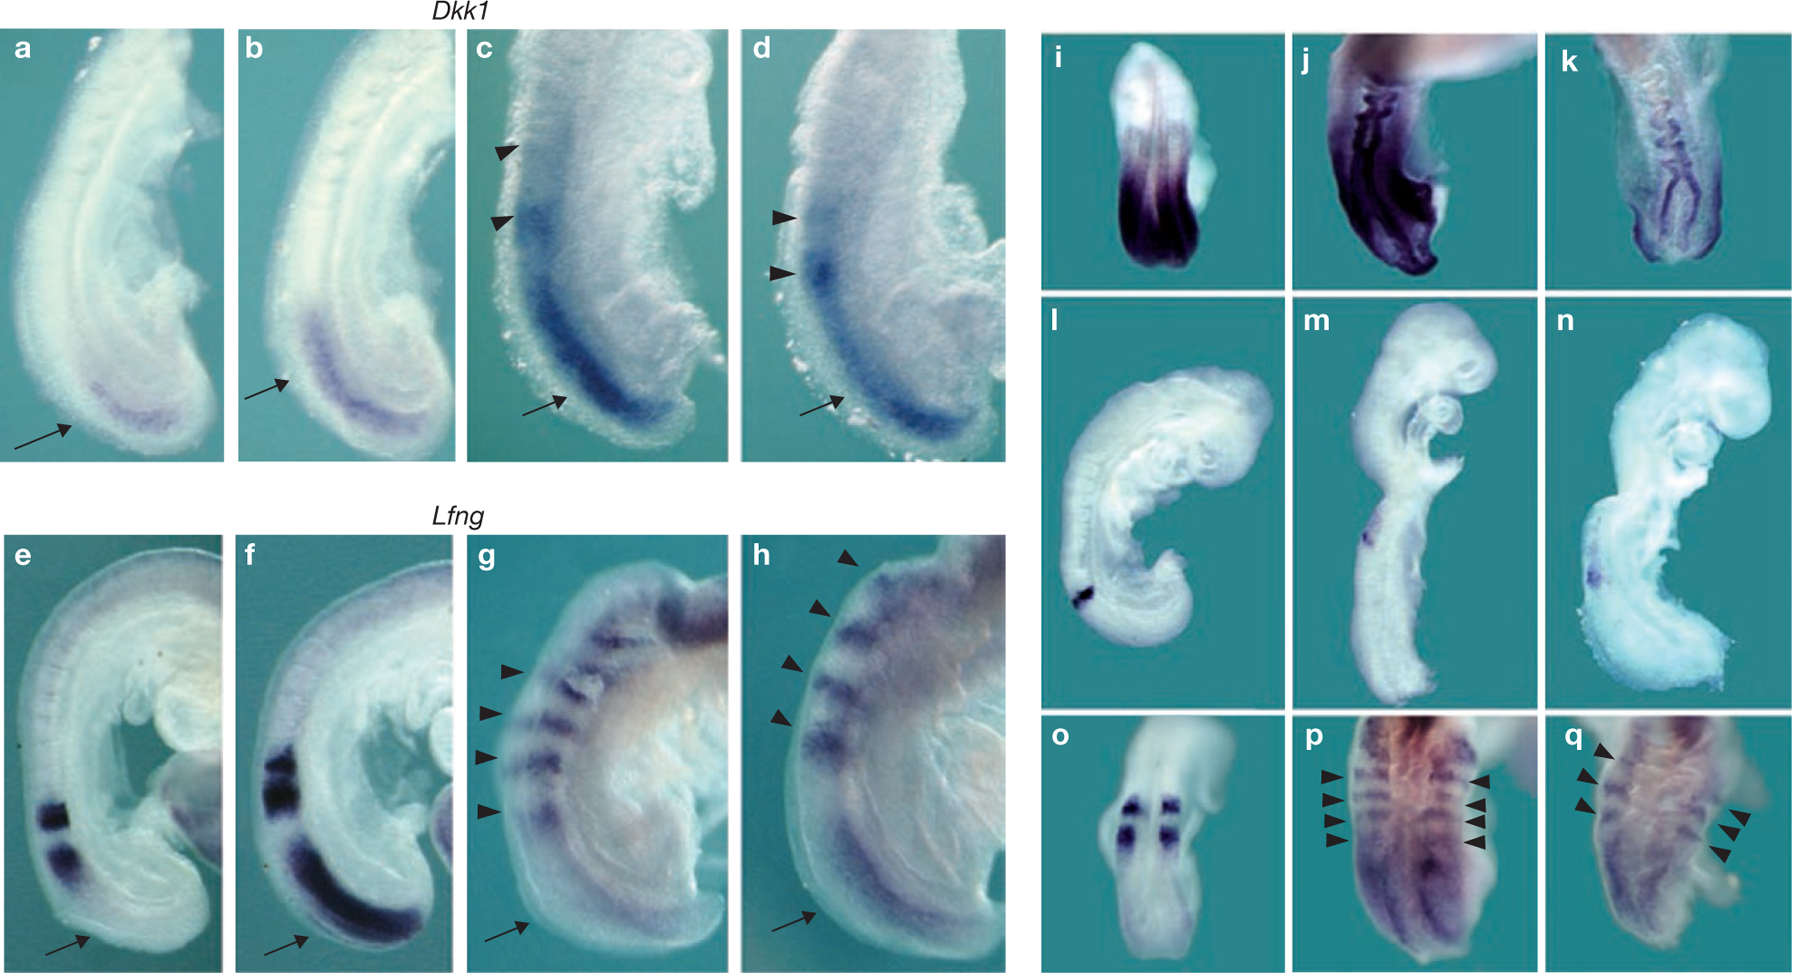
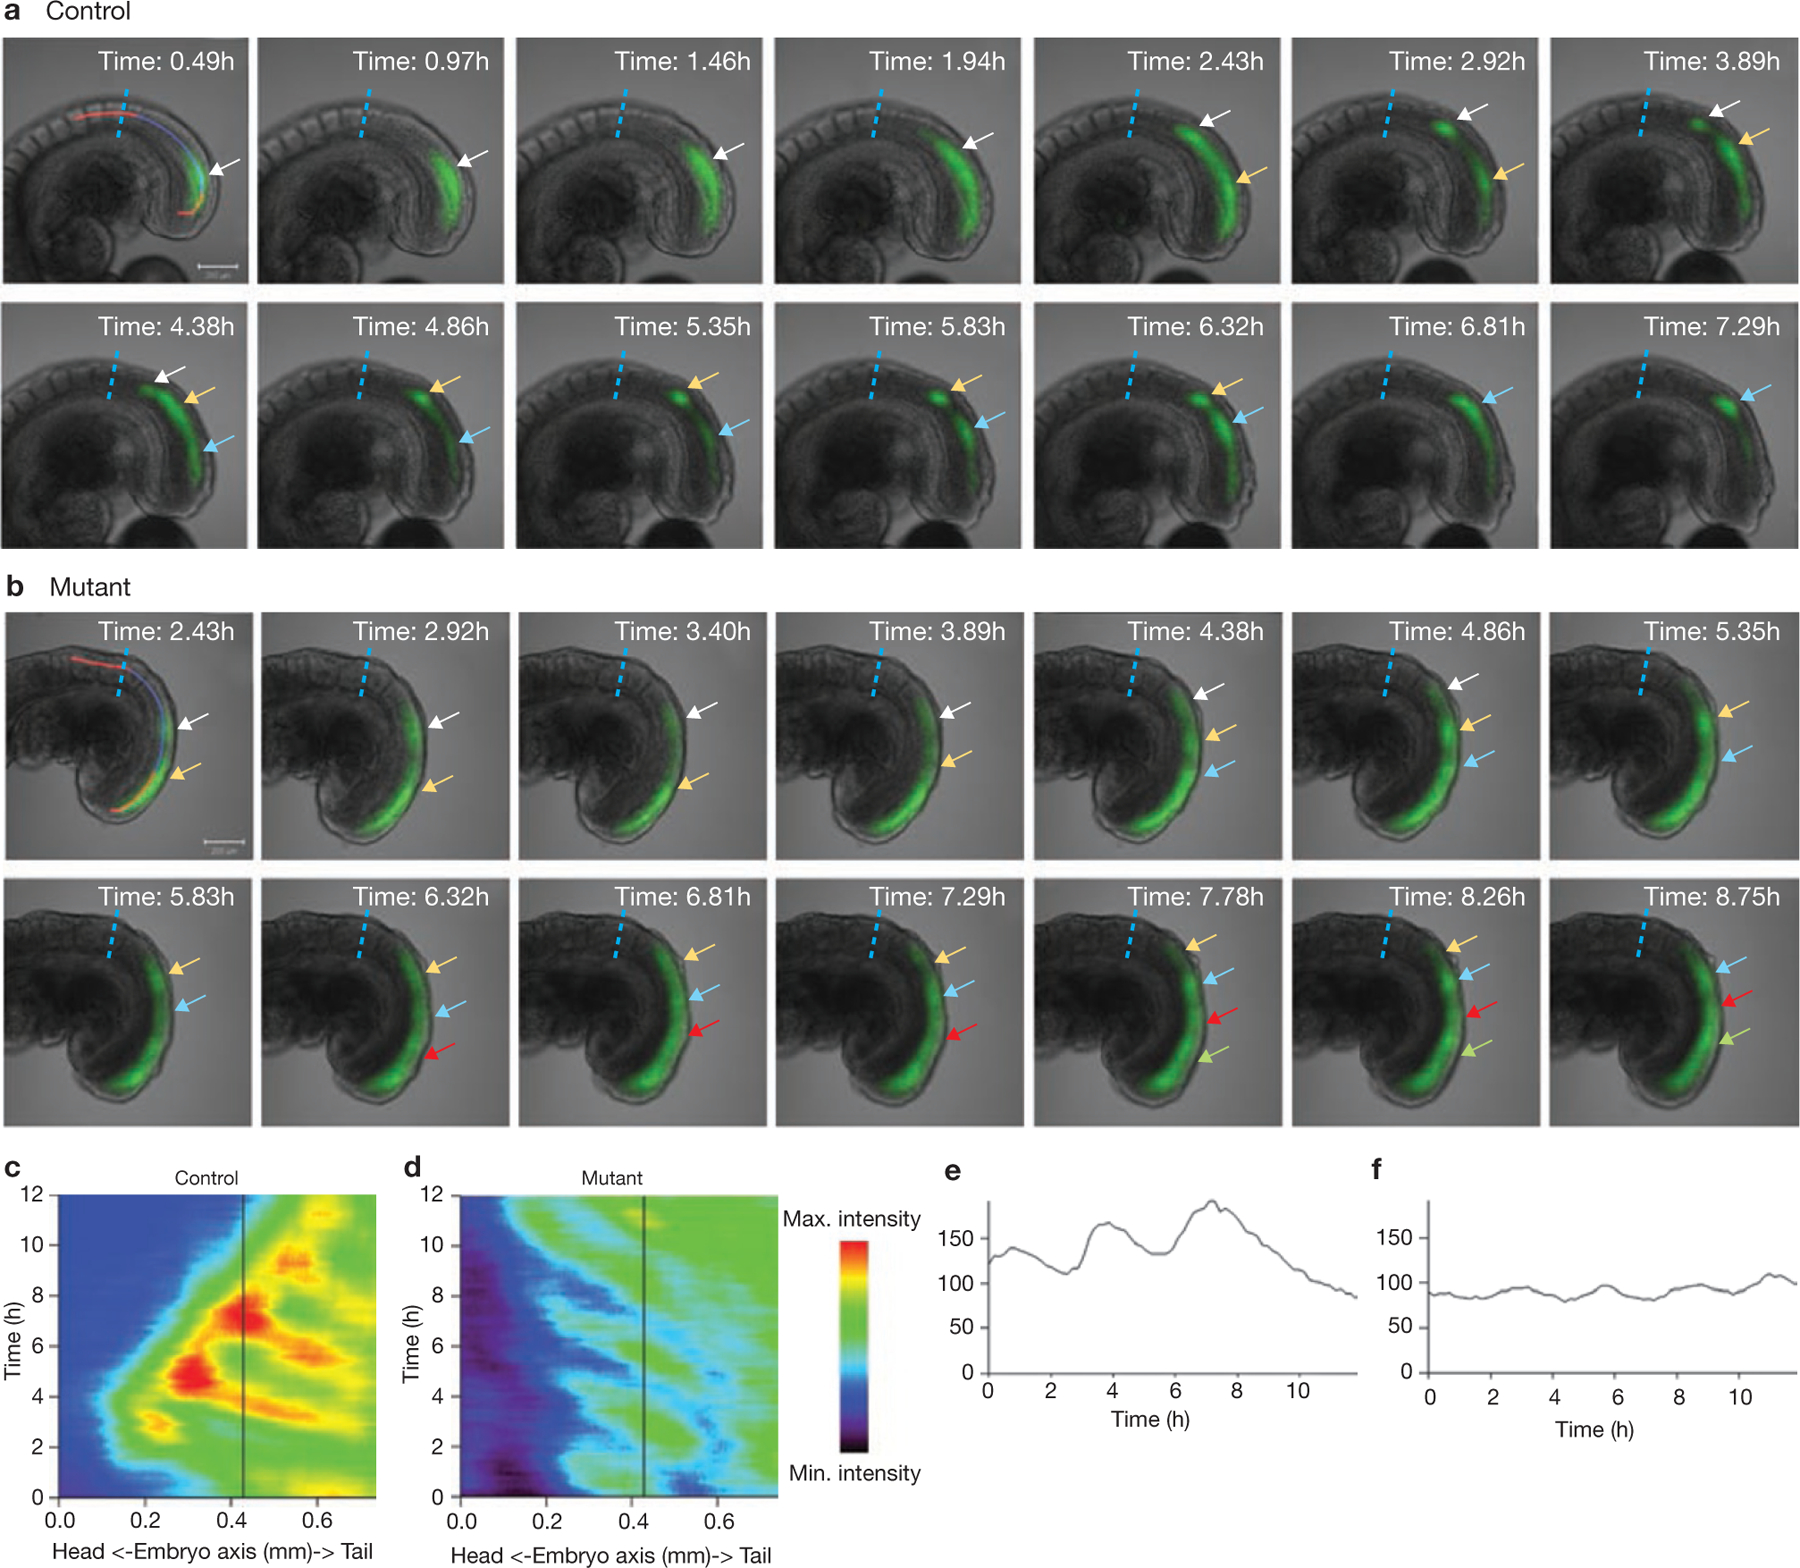
Rhythmic production of vertebral precursors, the somites, causes bilateral columns of embryonic segments to form. This process involves a molecular oscillator--the segmentation clock--whose signal is translated into a spatial, periodic pattern by a complex signalling gradient system within the presomitic mesoderm (PSM). In mouse embryos, Wnt signalling has been implicated in both the clock and gradient mechanisms, but how the Wnt pathway can perform these two functions simultaneously remains unclear. Here, we use a yellow fluorescent protein (YFP)-based, real-time imaging system in mouse embryos to demonstrate that clock oscillations are independent of beta-catenin protein levels. In contrast, we show that the Wnt-signalling gradient is established through a nuclear beta-catenin protein gradient in the posterior PSM. This gradient of nuclear beta-catenin defines the size of the oscillatory field and controls key aspects of PSM maturation and segment formation, emphasizing the central role of Wnt signalling in this process.


Figures

Figure 1
Figure 1
Conditional stabilization of β-catenin in mouse PSM disrupts somite formation. Fluorescence immunodetection of β-catenin (green) in saggital sections through the PSM of control (ac) and mutant β-catenindel(ex3)/+–T–Cre embryo (df). Nuclei were counterstained with DAPI (blue) and anterior is to the left. (a) A graded distribution of β-catenin protein along the antero-posterior axis showed predominant cytoplasmic localization in the anterior PSM (shown at higher magnification in b), and nuclear localization in the posterior PSM (shown at higher magnification in c). (d) Mutant embryo showing elevated, uniform levels of β-catenin throughout the PSM. Nuclear localization was found both in the anterior PSM (shown at higher magnification in e), as well as in the posterior PSM (shown at higher magnification in f). Scanning electron microscopy of control (g) and mutant β-catenindel(ex3)/+–T–Cre embryo (h). The ectoderm was partially removed during embryo processing. Nine somites were formed in the control embryo (g); however, no somites were visible in the mutant embryo (h). Note expanded, unsegmented PSM in mutant embryo. Scale bars in a and d represent 50 μm; scale bars in b, c, e and f represent 10 μm.
Figure 2
Figure 2
Expansion of posterior PSM identity in β-catenindel(ex3)/+ mutant embryos. In situ hybridization of embryonic day 9 control ((ah), β-catenindel(ex3)/+–T–Cre negative) and corresponding mutant littermates ((á–h´), β-catenindel(ex3)/+–T–Cre). Axin2 (a, á), Tbx6 (b, b´), Msgn1 (c, ć), Dll1 (d, d´), Fgf8 (e, é) and Pea3 (f, f´) showed an expanded expression domain in mutant embryos. Note that this expansion of expression in mutants is both absolute and relative to the total axis length when compared with control littermates. (g, g´) In contrast to the control embryo (g), Paraxis was only expressed transiently in the mutant embryo (g´). (h, h´) A shortened Raldh2 expression domain was found in mutant embryos (h´), compared with control littermates (h).
Figure 3
Figure 3
Anterior shift of determination front in β-catenindel(ex3)/+ mutant embryos. (a, b) Mesp2 expression in control (a) and mutant (b) embryo littermates. Mesp2 expression was shifted anteriorly in mutants. (c, d) Cer1 in control (c) and mutant (d) embryo littermates. (e, f) Epha4 expression in control (e) and mutant (f) embryo littermates. Epha4 and Cer1 were expressed as stripes in the anterior PSM of control embryos, but this expression domain was absent in mutant embryos. (g, h) Uncx4.1, which marks the posterior aspect of formed somites in control embryos (g), was markedly downregulated in mutant embryos (h). (i) Scheme of Mesp2 expression in control (left side) and mutant (right side) embryos. Note the anterior shift of Mesp2 expression in mutants based on measurements (Supplementary Information, Fig. S3). Lfng showed up to five additional stripes in anterior mutant PSM, of which the most anterior two stripes overlap with Mesp2 as judged from double in situ hybridizations (data not shown). In mutants, the posterior broad expression domain of Lfng was weaker but of a comparable size to control embryos.
Figure 4
Figure 4
Dynamic expression of Wnt and Notch cyclic genes is maintained in β-catenindel(ex3)/+ mutant PSM. (ad) Intronic Dkk1 pre-mRNA expression in control (a, b) and mutant PSM (c, d). PSM expression was highly variable in control embryos (a, b, arrows). The posterior expression domain in mutant littermates was highly variable, ranging from strong expression (c, arrow; 16 out of 32 embryos) to weak expression (d, arrow; 16 out of 32 embryos). In addition, stripes of expression in the middle PSM were observed in mutant embryos (c, d, arrowheads) but not in controls (a, b). (eh) In situ hybridization of Lfng in control (e, f) and mutant (g, h) embryos. Control embryos showed a highly dynamic posterior expression domain (e, f, arrows). Supernumerary stripes of Lfng expression were visible in the expanded anterior PSM of mutant embryos (g, h, arrowheads). In the posterior PSM of mutant littermates, expression ranged from weak (g, arrow; 8 out of 22 embryos) to strong (h, arrow; 14 out of 22 embryos). (iq) Analysis of compound β-cateninlox(ex3)/+–Fgfr1f/KO–T–Cre mutant embryos. Control embryos (i, l, o), β-cateninlox(ex3)/+–Fgfr1f/+–T–Cre single mutant embryos (j, m, p) and compound β-cateninlox(ex3)/+–Fgfr1f/KO–T–Cre double mutants (k, n, q) were hybridized for Dusp4 (ik), Mesp2 (ln) and Lfng (oq). The embryos in (j, k), (m, n), (p, q) were littermates, and were processed and stained together. Note that in compound mutants, the FGF signalling target Dusp4 was downregulated in the PSM (k, n = 8), whereas under these conditions Mesp2 still showed an anterior shift in the enlarged PSM (n, n = 5) compared with wild-type embryos (l); however, this anterior shift was less pronounced compared with the β-cateninlox(ex3)/+–Fgfr f/+–T–Cre single mutants (m). In the anterior PSM of compound mutants, we found several stripes of Lfng expression (q, arrowheads; n = 5), similar to that in the β-cateninlox(ex3)/+–Fgfr1f/+–T–Cre single mutants (p, arrowheads).
Figure 5
Figure 5
Real-time imaging of Lfng oscillations in control and β-catenindel(ex3)/+ mutant embryos. (a, b) Representative time series of control (a) and β-catenindel(ex3)/+–T–Cre–LuVeLu (b) embryos, reporting oscillations (green) of Venus–YFP fluorescence driven by the Lfng promoter. Only the posterior part of the embryo is shown. Arrows of different colours indicate successive Venus–YFP waves sweeping through the PSM. The corresponding time within the original time-lapse recording (Supplementary Information, Movies S1 and S2) is indicated in the upper right corner. The vertical dashed line (blue) represents a fixed point in the embryo for orientation. (c, d) Quantification of minimally processed fluorescence data. Fluorescence intensity is colour-coded (see colour code to the right of graphs) and plotted along PSM length (x-axis) and time (y-axis). The intensities were measured along the posterior line, shown in the first frame for each series in panels and centred in the PSM (a) and (b). Peaks of intensity in control (c) and mutant (d) traversed the embryos from posterior (right) to anterior (left) over time. The regression of the oscillatory field from anterior to posterior seen in control embryos was not observed in the mutant embryo during the recording time. (e, f) Fluorescence intensity (y-axis) at one given position within the PSM, as indicated by a vertical black line (c, d) shown over time (x-axis) of development. Note that at this fixed axial position, cells in the control embryo (e) showed three pronounced oscillations before oscillations stopped, caused by posterior regression of the oscillatory field. In contrast, cells at a similar position in the mutant embryo (f) continued to oscillate (five times) during the entire recording time (12 h), with lower overall intensity and lower amplitude.

References

    1. Palmeirim I, Henrique D, Ish-Horowicz D & Pourquié O Avian hairy gene expression identifies a molecular clock linked to vertebrate segmentation and somitogenesiss. Cell 91, 639–648 (1997). - PubMed
    1. Aulehla A et al. Wnt3a plays a major role in the segmentation clock controlling somitogenesis. Dev. Cell 4, 395–406 (2003). - PubMed
    1. Dequeant ML et al. A complex oscillating network of signalling genes underlies the mouse segmentation clock. Science 314, 1595–1598 (2006). - PubMed
    1. Nakaya MA et al. Wnt3a links left–right determination with segmentation and anteroposterior axis elongation. Development 132, 5425–5436 (2005). - PMC - PubMed
    1. Satoh W, Gotoh T, Tsunematsu Y, Aizawa S & Shimono A Sfrp1 and Sfrp2 regulate anteroposterior axis elongation and somite segmentation during mouse embryogenesis. Development 133, 989–999 (2006). - PubMed

Publication types

LinkOut - more resources