. 2008 Jan;38(1):240-9.
doi: 10.1002/eji.200737762.

Functional inhibition related to structure of a highly potent insulin-specific CD8 T cell clone using altered peptide ligands

Affiliations
Free PMC article

Functional inhibition related to structure of a highly potent insulin-specific CD8 T cell clone using altered peptide ligands

Liliana G Petrich de Marquesini et al. Eur J Immunol. 2008 Jan.
Free PMC article

Abstract

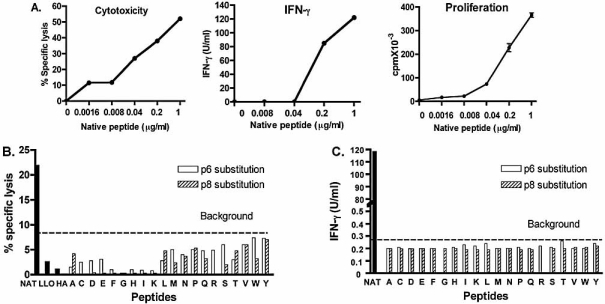
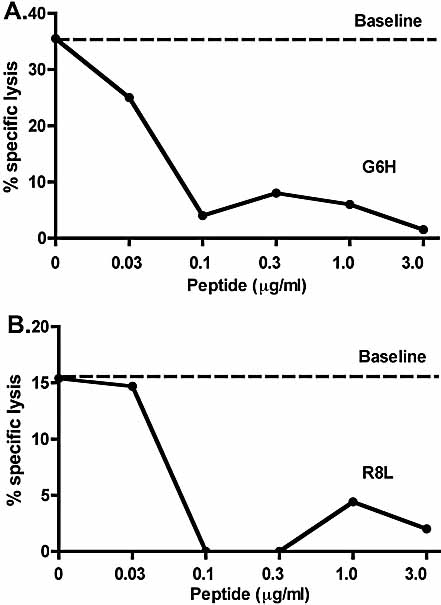
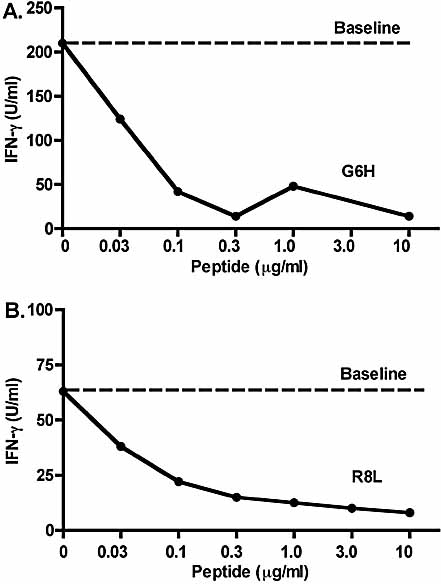
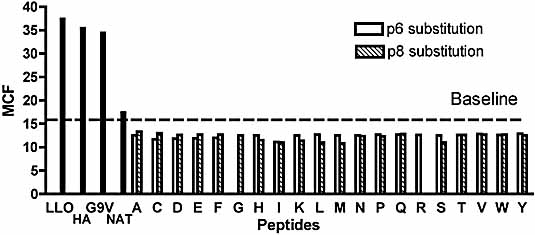
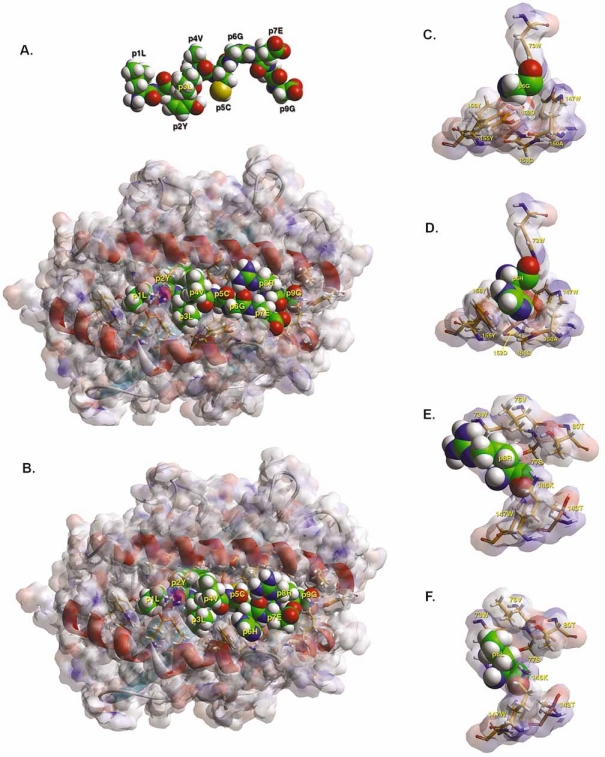
Insulin-reactive CD8 T cells are amongst the earliest islet-infiltrating CD8 T cells in NOD mice. Cloned insulin B15-23-reactive cells (designated G9C8), restricted by H-2K(d), are highly diabetogenic. We used altered peptide ligands (APL) substituted at TCR contact sites, positions (p)6 and 8, to investigate G9C8 T cell function and correlated this with structure. Cytotoxicity and IFN-gamma production assays revealed that p6G and p8R could not be replaced by any naturally occurring amino acid without abrogating recognition and functional response by the G9C8 clone. When tested for antagonist activity with APL differing from the native peptide at either of these positions, the peptide variants, G6H and R8L showed the capacity to reduce the agonist response to the native peptide. The antagonist activity in cytotoxicity and IFN-gamma production assays can be correlated with conformational changes induced by different structures of the MHC-peptide complexes, shown by molecular modeling. We conclude that p6 and p8 of the insulin B15-23 peptide are very important for TCR stimulation of this clone and no substitutions are tolerated at these positions in the peptide. This is important in considering the therapeutic use of peptides as APL that encompass both CD4 and CD8 epitopes of insulin.


Figures

Figure 1
Figure 1
Cytotoxicity and IFN-γ production assays using native peptide and APL with substitutions at p6 and p8. (A) 51Cr-release cytotoxicity assay was performed using increasing concentrations of native Ins B15–23 peptide with P815 target cells and G9C8 cloned T cells as effectors at an E:T ratio of 10:1 following 4 h of incubation. IFN-γ production was measured by ELISA following incubation with P815 cells and increasing concentrations of B15–23 peptide after 24 h incubation. Proliferation is shown by [3H]thymidine incorporation in cpm following incubation of G9C8 cloned T cells, in triplicate, with increasing concentrations of Ins B15–23 peptide. (B) P815 target cells were first incubated with 51Cr-sodium chromate and secondly with different concentrations of native peptide (NAT), irrelevant control peptides (LLO and HA) and peptides altered at position 6 and position 8. The G9C8 cloned T cells as effectors were added to the plates at an E:T ratio of 10:1. Data are shown for a peptide concentration of 1 μg/mL. The background when effectors and targets were incubated in the absence of peptide was 8.6% in this assay. The data are presented as percentage of specific lysis. Each value corresponds to the average of duplicate samples. Results shown represent one of at least two independent assays. (C) G9C8 cloned T cells were stimulated by peptide-pulsed P815 cells at five peptide concentrations within the range 0.008–5 μg/mL. IFN-γ production at 1 μg/mL is shown. Supernatants were tested in duplicate taken after 24-h incubation at 37°C. Results correspond to one of two independent experiments. The limit of detection for the assay was 0.27 U/mL.
Figure 2
Figure 2
Antagonism of cytotoxic response with APL G6H (A) and R8L (B). P815 cells were incubated with 51Cr-sodium chromate and with Ins B15–23 (1 μg/mL). The cells were then washed, and further incubated with the APL G6H (A) and R8L (B) at concentrations ranging from 0.03 to 10 μg/mL. The G9C8 cloned T cells were then added to the plate at E:T ratios of 10:1 (A) and 8:1 (B). After 4-h incubation, supernatant was assayed for 51Cr release. Results were expressed as % specific lysis. The baseline shown here corresponds to the cytotoxicity to the APC preincubated with the native peptide but without addition of APL.
Figure 3
Figure 3
Antagonism of IFN-γ production using APL with substitution at p6 (A) and p8 (B). P815 cells were pulsed with 5 μg/mL of native peptide, washed, and then incubated with different concentrations of the peptide variants G6H (A) and R8L (B) (range 0.03–10 μg/mL). G9C8 cloned T cells were added for a further incubation of 24 h. IFN-γ release was determined by ELISA and results expressed in U/mL. The baseline shown here corresponds to the IFN-γ production of the APC preincubated with the native peptide but without addition of APL.
Figure 4
Figure 4
MHC-APL-binding assays of the APL with substitutions at p6 and p8 of the Ins B15–23 peptide. The binding of the APL at p6 and p8 to the MHC molecule is shown at a peptide concentration of 6.25 μg/mL. All the APL, for p6 or p8, fall below the baseline (given by the MHC binding of RMAS-Kd cells stained with the FITC-conjugated anti-Kd mAb but without the addition of any peptide), and the binding of the native peptide (NAT) is just above baseline levels. By contrast, good binding to the H-2Kd molecule is seen for the peptides LLO, HA and G9V (NAT with the residue valine substituting glycine at p9, previously shown to bind well to the MHC 21).
Figure 5
Figure 5
Molecular modeling of H-2Kd−Ins B15–23 and mutated B15–23 peptides. (A) TCR view of the H-2Kd−Ins B15–23 complex, and side view of the peptide chain as bound in the groove of H-2Kd. This simulated structure is based on the crystal structure of H-2Kd in complex with an influenza nucleoprotein peptide . Several modes of structural rendering are shown simultaneously in order to appreciate how the peptide fits into the groove. The antigenic peptide is in space-filling form with its carbon atoms shown in green, nitrogen in blue, oxygen in red, hydrogen in white, and sulfur in orange. The α1α2 domain of the molecule is depicted according to its secondary structure in different regions: α-helix in red, β-pleated sheet in turquoise and random coil in grey. The solvent-accessible surface of the α1α2 domain is shown in grey with colorings according to the electrostatic surface potential (blue for positive, red for negative and intermediate hues for neutral). The surface of the heavy chain is made transparent so that peptide residue p2Y that is buried in pocket B, as well as the heavy chain residues making contact with the insulin peptide can be seen, albeit in a lighter color. These residues are shown with their carbon atoms in orange, while the color convention for the other atoms is identical to that for the antigenic peptide. (B) Modeled structure of the H-2Kd molecule with the Ins B15–23 p6H variant peptide, in the same orientation as the figure for the corresponding complex of the native peptide (A). Rendering and color conventions as in (A). (C) Molecular environment in p6 of the modeled complex with view of p6 containing the insulin peptide B15–23/B20G (p6G) residue and surrounding MHC heavy chain amino acids, in the complex of H-2Kd and Ins B15–23, as seen from above (TCR view). Color, surface electrostatic, and transparency conventions are as in (A). Some of the surrounding residues are at a distance longer than 4 Å, but are shown for comparison with (D). (D) View of p6 of the complex of H-2Kd with Ins B15–23/B20H (p6H), in the same orientation and conventions as in (C). All the surrounding residues from the heavy chain are at a distance of less than 4 Å. (E) View of p8 containing the Ins B15–23/B22R (p8R) residue and surrounding heavy chain amino acids, in the complex of H-2Kd and Ins B15–23, as seen from above (TCR view). Representations, color, surface electrostatic, and transparency conventions are as in (A). All the surrounding residues from the heavy chain are at a distance of less than 4 Å. (F) View of p8 of the complex of Kd with Ins B15–23/B22Leu (p8L), in the same orientation and conventions as in (E).

Similar articles

Cited by

References

    1. Evavold BD, Sloan-Lancaster J, Allen PM. Tickling the TCR: selective T-cell functions stimulated by altered peptide ligands. Immunol. Today. 1993;14:602–609. - PubMed
    1. Sloan-Lancaster J, Allen PM. Altered peptide ligand-induced partial T cell activation: molecular mechanisms and role in T cell biology. Annu. Rev. Immunol. 1996;14:1–27. - PubMed
    1. Kalergis AM, Nathenson SG. Altered peptide ligand-mediated TCR antagonism can be modulated by a change in a single amino acid residue within the CDR3 beta of an MHC class I-restricted TCR. J. Immunol. 2000;165:280–285. - PubMed
    1. Ford ML, Evavold BD. An MHC anchor-substituted analog of myelin oligodendrocyte glycoprotein 35–55 induces IFN-gamma and autoantibodies in the absence of experimental autoimmune encephalomyelitis and optic neuritis. Eur. J. Immunol. 2004;34:388–397. - PubMed
    1. Ryan KR, McNeil LK, Dao C, Jensen PE, Evavold BD. Modification of peptide interaction with MHC creates TCR partial agonists. Cell. Immunol. 2004;227:70–78. - PubMed

Publication types