Evaluation of point-of-care glucose testing accuracy using locally-smoothed median absolute difference curves
- PMID: 18157943
- PMCID: PMC2613941
- DOI: 10.1016/j.cca.2007.11.019
Evaluation of point-of-care glucose testing accuracy using locally-smoothed median absolute difference curves
Abstract
Background: We introduce locally-smoothed (LS) median absolute difference (MAD) curves for the evaluation of hospital point-of-care (POC) glucose testing accuracy.
Methods: Arterial blood samples (613) were obtained from a university hospital blood gas laboratory. Four hospital glucose meter systems (GMS) were tested against the YSI 2300 glucose analyzer for paired reference observations. We made statistical comparisons using conventional methods (e.g., linear regression, mean absolute differences).
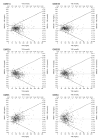
Results: Difference plots with superimposed ISO 15197 tolerance bands showed bias, scatter, heteroscedasticity, and erroneous results well. LS MAD curves readily revealed GMS accuracy patterns. Performance in hypoglycemic and hyperglycemic ranges erratically exceeded the recommended LS MAD error tolerance limit (5 mg/dl). Some systems showed acceptable (within LS MAD tolerance) or nearly acceptable performance in and around a tight glycemic control (TGC) interval of 80-110 mg/dl. Performance patterns varied in this interval, creating potential for discrepant therapeutic decisions.
Conclusions: Erroneous results demonstrated by ISO 15197-difference plots must be carefully considered. LS MAD curves draw on the unique human ability to recognize patterns quickly and discriminate accuracy visually. Performance standards should incorporate LS MAD curves and the recommended error tolerance limit of 5 mg/dl for hospital bedside glucose testing. Each GMS must be considered individually when assessing overall performance for therapeutic decision making in TGC.
Figures


Comment in
-
Median differences or actual differences?Clin Chim Acta. 2008 May;391(1-2):126; author reply 127-8. doi: 10.1016/j.cca.2008.02.007. Epub 2008 Feb 15. Clin Chim Acta. 2008. PMID: 18328263 No abstract available.
References
-
- Tran NK, Promptmas C, Kost GJ. Biosensors, miniaturization, and noninvasive techniques. In: Ward Cook KM, Lehman CA, Schoeff LE, et al., editors. Clinical Diagnostic Technology: The Total Testing Process Volume 3: The Postanalytical Phase. Chapter 7. Washington D.C.: American Association for Clinical Chemistry Press; 2006. pp. 145–184.
-
- Clarke WL, Cox D, Gonder-Frederick LA, et al. Evaluating clinical accuracy of systems for self monitoring of blood glucose. Diabetes Care. 1987;10:622–628. - PubMed
-
- Bland JM, Altman DG. Statistical methods for assessing agreement between two methods of clinical measurement. Lancet. 1986;1:307–310. - PubMed
-
- International Organization for Standardization. In Vitro Diagnostic Test Systems— Requirements for Blood-Glucose Monitoring Systems for Self-Testing in Managing Diabetes Mellitus International Standard Report Number ISO 15197:2003(E) Geneva: International Organization for Standardization; 2003.
-
- Kost GJ, Louie R, Veerasamy N, et al. Meeting the challenge of the International Standard ISO 15197 for capillary glucose accuracy. Clin Chem. 2005;51:A255. abstract.
Publication types
MeSH terms
Substances
Grants and funding
LinkOut - more resources
Full Text Sources
Medical

