. 2007 Dec 31;179(7):1413-26.
doi: 10.1083/jcb.200706179. Epub 2007 Dec 24.

PR-Set7-dependent lysine methylation ensures genome replication and stability through S phase

Affiliations

PR-Set7-dependent lysine methylation ensures genome replication and stability through S phase

Mathieu Tardat et al. J Cell Biol. .

Abstract

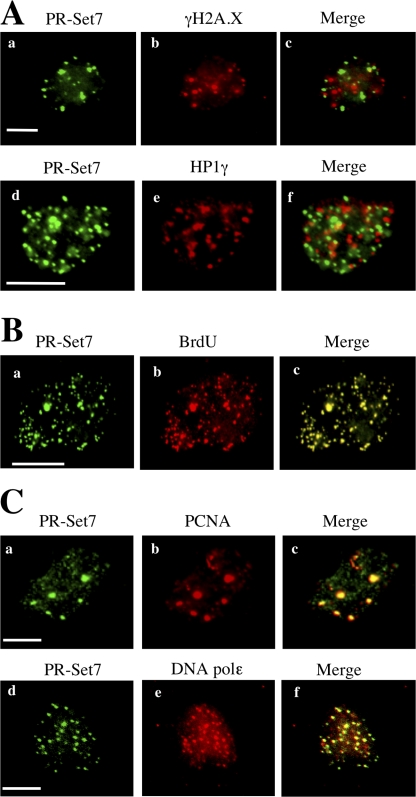
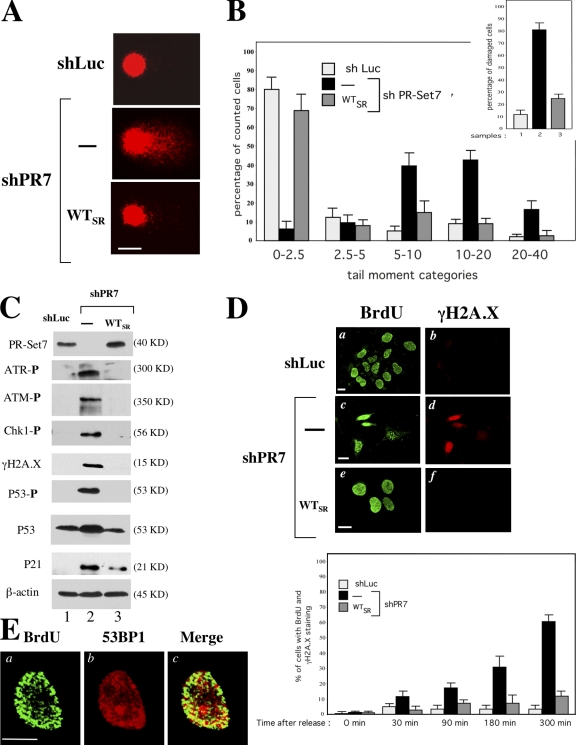
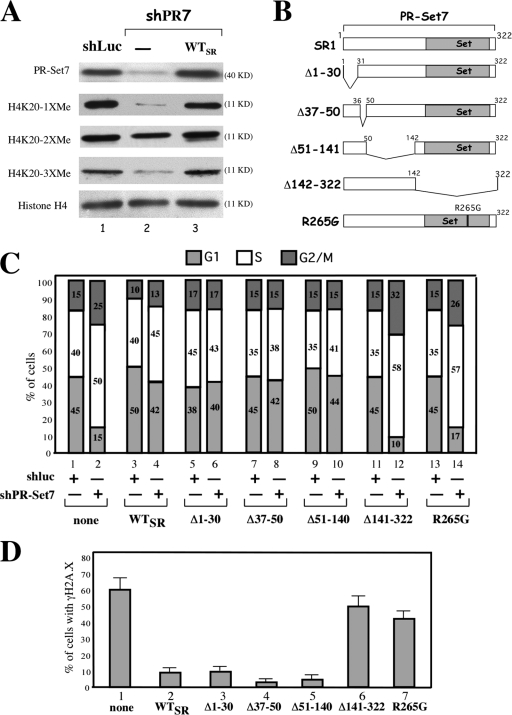
PR-Set7/SET8 is a histone H4-lysine 20 methyltransferase required for normal cell proliferation. However, the exact functions of this enzyme remain to be determined. In this study, we show that human PR-Set7 functions during S phase to regulate cellular proliferation. PR-Set7 associates with replication foci and maintains the bulk of H4-K20 mono- and trimethylation. Consistent with a function in chromosome dynamics during S phase, inhibition of PR-Set7 methyltransferase activity by small hairpin RNA causes a replicative stress characterized by alterations in replication fork velocity and origin firing. This stress is accompanied by massive induction of DNA strand breaks followed by a robust DNA damage response. The DNA damage response includes the activation of ataxia telangiectasia mutated and ataxia telangiectasia related kinase-mediated pathways, which, in turn, leads to p53-mediated growth arrest to avoid aberrant chromosome behavior after improper DNA replication. Collectively, these data indicate that PR-Set7-dependent lysine methylation during S phase is an essential posttranslational mechanism that ensures genome replication and stability.


Figures

Figure 1.
Figure 1.
PR-Set7 localizes at sites of DNA synthesis. (A) Nuclei of asynchronously growing U2OS cells treated for 1 h with 15 μM MG132 to inhibit proteasome degradation and permeabilized for 10 min with 0.5% Triton X-100 to remove soluble nuclear and cytoplasmic proteins before PFA fixation. Cells were stained with anti–PR-Set7 (a and d), anti–γ-H2A.X (b), or anti-HP1γ (e) antibodies. Staining with anti–PR-Set7 (d) and anti–γ-H2A.X (b) was performed in U2OS cells treated with both MG132 and 25 μg/ml bleomycin for 1 h before fixation. (B) Nuclei of U2OS cells stained with anti–PR-Set7 (a) and anti-BrdU (b) antibodies. Cells were pulse labeled for 10 min with BrdU and treated as described in A before fixation. (C) Nuclei of asynchronously growing U2OS cells treated as described in A and stained with anti–PR-Set7 (a and d), anti–proliferating nuclear antigen A (b), or anti-DNA polymerase ɛ (e) antibodies. Bars, 5 μm.
Figure 2.
Figure 2.
PR-Set7–depleted cells display improper S-phase progression. (A) Immunoblot analysis of U2OS cells (lanes 1 and 2) and U2OS cells synthesizing the PR-Set7SR recombinant protein (lanes 3 and 4) 2 d after either luciferase (lanes 1 and 3) or PR-Set7 (lanes 2 and 4) shRNA expression. shLuc for luciferase shRNA and shPR7 for PR-Set7 shRNA. The PR-Set7SR protein is visualized alone (HA tag antibody; top) or together with endogenous PR-Set7 proteins (middle). β-actin (bottom) is used as a loading control. Resistance to shPR7 treatment is given by five silent mutations in the mRNA sequence targeted by shPR7. (B) Proliferation rates of U2OS cells expressing either luciferase (shLuc) or PR-Set7 (shPR-Set7) shRNA and U2OS cells synthesizing PR-Set7SR (U2OSSR) and expressing PR-Set7 shRNA. The proliferation rate of U2OSSR cells expressing luciferase shRNA is similar to shluc U2OS cells (not depicted). At the indicated times, cells were harvested and counted from duplicate plates, and the results were averaged. The number of cells is represented on a logarithmic scale. (C) Cell cycle profiles of shLuc (a, d, and g) or shPR7 (b, e, and h) U2OS cells and shPR7 U2OSSR cells (c, f, and i). At the times indicated, cells were labeled with BrdU for 1 h before harvest and were stained with an anti-BrdU antibody and 7AAD. Only histograms of DNA fluorescence are shown. (D, top) Western blot analysis for PR-Set7 and β-actin levels in U2OS and U2OSSR cells arrested at G1/S stage by thymidine block 2 d after shRNA expression and released into S phase 20 h later. (bottom) Cell cycle distribution of shLuc (left) or shPR7 U2OS cells (middle), and shPR7 U2OSSR cell (right) release into S phase from a thymidine block (0 h) and pulse labeled for 1 h with BrdU at the times indicated below each panel. The percentage of cells in each stage of the cell cycle was monitored by measuring BrdU incorporation and DNA content with a flow cytometer in three independent experiments.
Figure 3.
Figure 3.
PR-Set7 silencing causes massive DNA breaks during S phase, which leads to activation of the DNA damage checkpoint. (A) Representative comets of shLuc and shPR7 U2OS cells and shPR7 U2OSSR cells. Alkaline comet analysis was performed 3 d after shRNA expression. At least 200 randomly chosen comets were captured. (B) Distribution of cells with different comet tail moments and quantification of the number of cells with comet tail moments greater than five (inset) are illustrated for each cell line. The tail moment and distribution were scored from 200 cells/slide by using Comet Imager 1.2.10 software. (C) Immunoblot analysis of the total levels of p53 and P21 and the levels of phosphorylation of ATM, ATR, CHK1, H2A.X, and p53 in U2OS (lanes 1 and 2) and U2OSSR (lane 3) cells 3 d after either shLuc (lane 1) or shPR7 (lanes 2 and 3) expression. (D) Immunofluorescence of BrdU (a, c, and e) and γ-H2A.X (b, d, and f) in shLuc and shPR7 U2OS cells and shPR7 U2OSSR cells 3 h after release from a thymidine block. (bottom) Quantification of double BrdU and γ-H2A.X–positive cells in shRNA-expressing U2OS and U2OSSR cell lines. Cells were harvested and analyzed by immunofluorescence at the times indicated. The percentages of double BrdU and γ-H2A.X–positive cells were obtained by counting 300 cells from three independent experiments. Error bars represent SD. (E) Images of asynchronous shPR7 U2OS nuclei acquired with Apotome microscopy 3 d after shRNA expression. After BrdU incorporation for 10 min, cells were stained with anti-BrdU antibody to detect active replication foci (a) and anti-53BP1 antibody to detect DNA damage foci (b). The merged picture (c) showed a partial but significant overlay. Bars, 5 μm.
Figure 4.
Figure 4.
PR-Set7 regulates replication fork activity. (A) Distribution of fork velocity from 200 ongoing replication forks in shLuc or shPR7 U2OS cells and in shPR7 U2OSSR cells (left). Squares represent the quartiles (25% of the fork rate values smaller and higher than the median value), and the deviations show the smallest and greatest fork rate values. Mean fork rates with SDs are indicated for each sample (right). P < 0.0002 as determined by the nonparametric test of Mann-Whitney. (B) Distribution of replicated track lengths after 30 min of BrdU incorporation in shLuc U2OS (top), shPR7 U2OS and U2OSSR cells (middle), and shPR7 U2OS treated with caffeine for 5 h (bottom). Mean lengths with SDs are indicated for each panel. Results were averaged from five independent experiments. (C) Quantification of active replication sites for 10 Mb DNA in BrdU-positive shLuc (bar 1) or shPR7 (bar 2) U2OS cells, BrdU-positive shPR7 U2OSSR cells (bar 3), and BrdU-positive shPR7 U2OS cells treated with caffeine for 5 h (bar 4). The number of active replication sites was obtained by counting the number of individual BrdU tracks for 10 Mb DNA 3 d after shRNA expression in five independent DNA combing experiments. Error bars represent SD. (D) Distances between replicated tracks labeled with BrdU in shLuc and shPR7 U2OS cells, shPR7 U2OSSR cells, and shPR7 U2OS cells treated with caffeine for 5 h. The mean distances with SDs are indicated (right). (B and D) P < 0.0001 as determined by the nonparametric test of Mann-Whitney. (E) Cell cycle profiles of shPR7 U2OS cells untreated or treated with caffeine 3 d after shRNA expression. At the starting time point (top), cells were untreated (middle) or treated (bottom) with caffeine, and, 5 h later, they were labeled with BrdU before harvest and stained with an anti-BrdU antibody and 7AAD. Only histograms of DNA fluorescence are shown.
Figure 5.
Figure 5.
Growth-arrest functions of p53 avoid aberrant mitotic chromosome behavior after improper DNA replication in PR-Set7–depleted cells. (A) Cell cycle profiles of HNF and HNFE6 4 d after shLuc or shPR7 expression. Histograms of DNA content are shown. (B) Immunofluorescence analysis of mitotic HNFE6 4 d after shLuc (a–c) or shPR7 (d–i) expression. DAPI staining (a, d, and g), H2A.X staining (b, e, and h), and phosphorylated histone H310 staining (c, g, and j) are shown. Note the abnormal DAPI staining in shPR7 HNFE6. (C) Chromosome spreads of shLuc (a) and shPR7 (b–d) HNFE6. (b and c) Examples of mitotic shPR7 HNFE6 showing improper chromosome condensation. (d1–4) Magnification of the selected areas from panel d showing chromosomal aberrations in shPR7 HNFE6. Bars: (B) 5 μm; (C) 2.5 μm.
Figure 6.
Figure 6.
PR-Set7 regulates H4-K20 mono- and trimethylation, an essential function for proper S-phase progression and genomic stability. (A) Immunoblot analysis of the levels of PR-Set7, histone H4, H4-K20me1, H4-K20me2, and H4-K20me3 in U2OS and U2OSSR cells 3 d after shLuc or shPR7 expression. (B) Schematic structures of the shRNA-resistant wild-type (SR1), truncated (Δ1–30, Δ37–50, Δ51–140, and Δ141–322), and mutated (R265G) PR-Set7 recombinant proteins. (C) Cell cycle distribution of parental cells (bars 1 and 2) or cells synthesizing the indicated shRNA-resistant PR-Set7 recombinant proteins (bars 3–14) 3.5 d after shLuc (odd-numbered bars) or shPR7 (even-numbered bars) expression. The percentage of cells in each stage of the cell cycle is shown and was obtained by measuring BrdU incorporation (1-h pulse labeling before harvest) and DNA content with flow cytometry in three independent experiments. (D) Quantification of γ-H2A.X–positive cells in parental U2OS cells and cells synthesizing the indicated shRNA-resistant PR-Set7 recombinant proteins 3.5 d after shPR7 expression. The percentage of γ-H2A.X cells was obtained by counting 100 cells in three independent experiments. No γ-H2A.X signal was detected in the different PR-Set7 recombinant–expressing cell lines untreated or treated with luciferase shRNA (not depicted). Error bars represent SD.

References

    1. Anglana, M., F. Apiou, A. Bensimon, and M. Debatisse. 2003. Dynamics of DNA replication in mammalian somatic cells: nucleotide pool modulates origin choice and interorigin spacing. Cell. 114:385–394. - PubMed
    1. Baus, F., V. Gire, D. Fisher, J. Piette, and V. Dulic. 2003. Permanent cell cycle exit in G2 phase after DNA damage in normal human fibroblasts. EMBO J. 22:3992–4002. - PMC - PubMed
    1. Bartkova, J., Z. Horejsi, K. Koed, A. Kramer, F. Tort, K. Zieger, P. Guldberg, M. Sehested, J.M. Nesland, C. Lukas, et al. 2005. DNA damage response as a candidate anti-cancer barrier in early human tumorigenesis. Nature. 434:864–870. - PubMed
    1. Bartkova J., N. Rezaei, M. Liontos, P. Karakaidos, D. Kletsas, N. Issaeva, L.V. Vassiliou, E. Kolettas, K. Niforou, V.C. Zoumpourlis, et al. 2006. Oncogene-induced senescence is part of the tumorigenesis barrier imposed by DNA damage checkpoints. Nature. 444:633–637. - PubMed
    1. Beisel C., A. Imhof, J. Greene, E. Kremmer, and F. Sauer. 2002. Histone methylation by the Drosophila epigenetic transcriptional regulator Ash1. Nature. 419:857–862. - PubMed

Publication types

MeSH terms