. 2007 Dec 31;179(7):1523-37.
doi: 10.1083/jcb.200706181. Epub 2007 Dec 24.

Axons of retinal ganglion cells are insulted in the optic nerve early in DBA/2J glaucoma

Affiliations

Axons of retinal ganglion cells are insulted in the optic nerve early in DBA/2J glaucoma

Gareth R Howell et al. J Cell Biol. .

Abstract

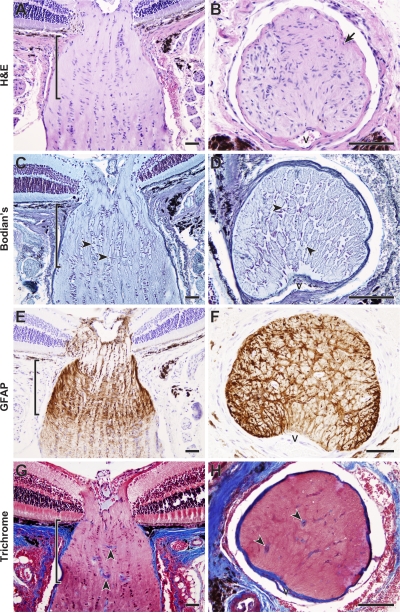
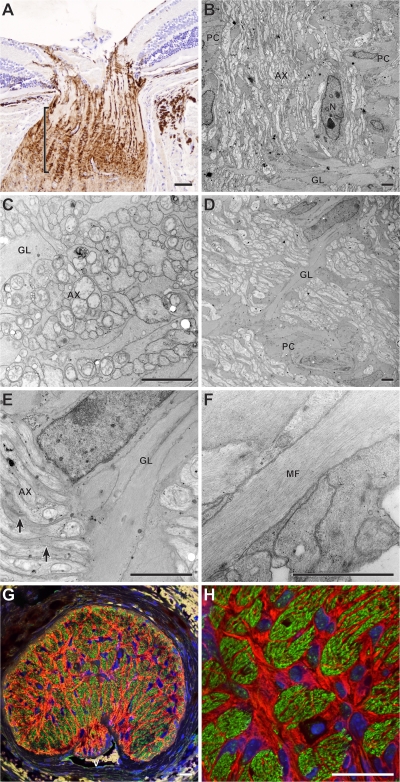
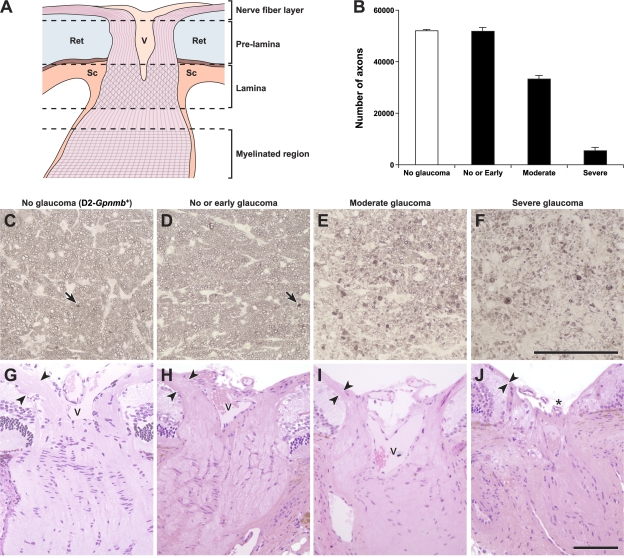
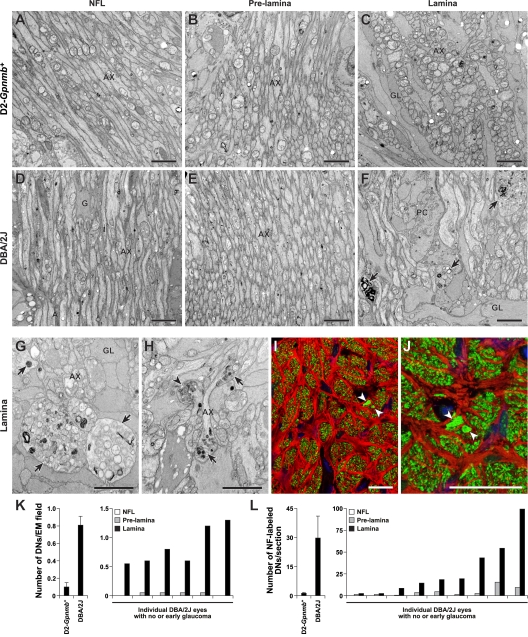
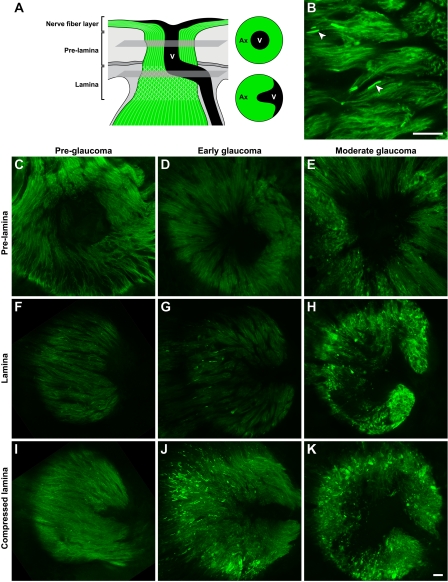
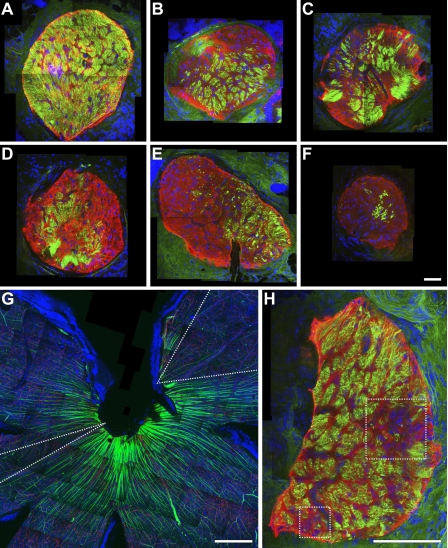
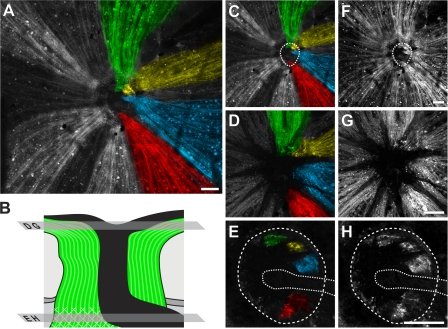
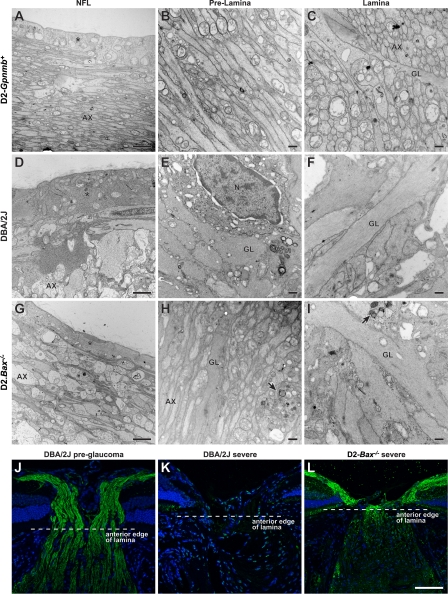
Here, we use a mouse model (DBA/2J) to readdress the location of insult(s) to retinal ganglion cells (RGCs) in glaucoma. We localize an early sign of axon damage to an astrocyte-rich region of the optic nerve just posterior to the retina, analogous to the lamina cribrosa. In this region, a network of astrocytes associates intimately with RGC axons. Using BAX-deficient DBA/2J mice, which retain all of their RGCs, we provide experimental evidence for an insult within or very close to the lamina in the optic nerve. We show that proximal axon segments attached to their cell bodies survive to the proximity of the lamina. In contrast, axon segments in the lamina and behind the eye degenerate. Finally, the Wld(s) allele, which is known to protect against insults to axons, strongly protects against DBA/2J glaucoma and preserves RGC activity as measured by pattern electroretinography. These experiments provide strong evidence for a local insult to axons in the optic nerve.


Figures

Figure 1.
Figure 1.
Aged mice have a robust glial lamina that lacks ECM plates. (A–F) Optic nerves of 11–12-mo-old DBA/2J mice that do not develop glaucoma (D2-Gpnmb +) were serially sectioned in longitudinal or cross-sectional planes. A robust astrocyte meshwork surrounds the axons where they exit the mouse eye. The astrocyte meshwork (glial lamina, delineated by brackets) is clearly evident as abundant nuclei oriented at right angles to the long axis of the optic nerve (A and B) and a cellular network (C and D, arrowheads) with extensive processes that stain positive for GFAP (E and F). In contrast to the lamina cribrosa of the human optic nerve (see Quigley and Addicks [1981]), the mouse astrocytes do not cover a network of robust collagenous plates (G and H). Although collagens are clearly visible in blood vessel walls (arrowheads), there is no meshwork of collagen staining that mirrors the astrocyte meshwork. All presented cross sections are from within the lamina region. V, vessels. Sections were stained with hematoxylin and eosin (H&E) (A and B, cells and axons pink; nuclei purple-blue); Bodian's stain (C and D, axons pale blue; nuclei dark purple-blue; glial cell bodies and processes remain clear); anti-GFAP with hematoxylin counter stain (E and F, astrocyte bodies and processes brown; nuclei purple-blue); or Masson's trichrome (G and H, collagens stain blue). Bars, 50 μm.
Figure 2.
Figure 2.
Intimate association of axons and astrocytes in the mouse glial lamina. (A–F) All electron micrographs are in the longitudinal plane and from the intensely GFAP-positive region delineated by the bracket. (B) In this region, bundles of axons (AX) are enclosed between columns of astrocytes (pial columns, PC) that run in a rostral-caudal direction. The glial meshwork of the lamina (GL) is oriented at right angles to the pial columns. N, astrocyte nucleus. (C–E) The axons and glia are closely packed and glial processes (E, arrows) have an intimate association with individual axons. (F) At higher magnification, microfibrils (MF) identify astrocyte processes that are easily differentiated from axons. No collagenous plate-like structures were associated with the astrocytes. (G and H) Confocal microscopic analysis of a cross section through the same region also indicates a very intimate association between glia and axons. Anti-neurofilament (axons), green; anti-GFAP (astrocytes), red; DAPI (nuclei), blue. V, vessels. (A) Bar, 50 μm. (B–F) Bars, 2 μm. (G and H) Bars, 20 μm.
Figure 3.
Figure 3.
Optic nerve regions and damage levels. (A) Schematic showing the regions we defined as nerve fiber layer, pre-lamina, and lamina (not to scale). Axons (pink) course into the optic nerve head, pass out of the eye through the glial lamina (crosshatches, located within the scleral canal) and become myelinated behind the eye (horizontal lines). Ret, retina; V, vessels; Sc, sclera. (B) The severity of glaucomatous nerve damage was determined in a retro-orbital portion of each optic nerve (Materials and methods). Each assigned damage level is clearly different by axon counting. Axon counts were as follows: D2-Gpnmb + with no glaucoma (white bar) 52074 ± 451 (n = 10), DBA/2J mice (black bars), with no or early glaucoma 51862 ± 934 (n = 10), moderate glaucoma 33283 ± 2199 (n = 15), and severe glaucoma 5454 ± 1211 (n = 24). The axon counts for nerves with no or early damage were not statistically different to the no glaucoma D2-Gpnmb + controls. They are classified as no or early glaucoma because no glaucomatous nerve damage is detected behind the eye but at the assessed ages some of the eyes must be at early stages of glaucoma. The differences comparing the no or early, moderate, and severe damage levels were significant (P < 0.001). (C–J) Representative images of D2-Gpnmb + with no glaucoma (C and G) and DBA/2J with no or early glaucoma (D and H), moderate glaucoma (E and I), and severe glaucoma (F and J). Very mild, age-related damage, similar to that which occurs in other nonglaucomatous mouse strains, occurs in the D2-Gpnmb + strain (C, arrow shows a single damaged axon that stains darkly with PPD, Materials and methods). This age-related damage is also seen in DBA/2J optic nerves that were determined to have no or early glaucoma (D, arrow). Nerve fiber layer thinning (arrowheads) is evident in H&E-stained sections of moderately affected nerves and severe nerves have obvious nerve fiber layer loss and optic nerve excavation (asterisk). These changes are hallmarks of glaucoma. C–F are semi-thin sections stained with PPD. G–J are plastic sections stained with H&E. V, vessels. Bars, 100 μm.
Figure 4.
Figure 4.
Early damage to RGC axons occurs at the lamina. RGC axons were analyzed for glaucomatous damage at different locations as they extend across the retina and exit the eye. Damage was assessed in the nerve fiber layer (NFL), the prelamina, and glial lamina regions of the optic nerve. All mice were 11 mo old and had no or early glaucoma based on analysis of the retro-orbital optic nerve. (A–C) D2-Gpnmb + no glaucoma controls, the axons were healthy and had normal morphology at all locations based on electron microscopy. Only rare damaged axons were detected. This rare age-related damage occurs in aged mice of various strains that do not develop glaucoma. (D–F) The axons of age- and sex-matched DBA/2J mice with early glaucoma did not differ from controls at any intraocular location, as they extended from the cell body to the lamina. At the glial lamina, however, dystrophic neurites (F, arrows) were readily detected. (G and H) The dystrophic neurites (arrows) consisted of swollen and damaged axon segments containing an accumulation of organelles including swollen mitochondria (arrowhead). (I and J) Due to the accumulation and disorganization of axonal contents, dystrophic neurites were also detected using a combination of both nonphosphorylated (Smi32) and phosphorylated (Smi34) neurofilament antibodies (green). They were visible as abnormally large and bright staining, damaged axon regions (arrows) in the lamina. Although dystrophic neurites labeled with each antibody (not depicted), we used the combination to maximize the intensity of staining. GFAP-positive astrocytes are shown in red. (K and L) Counting dystrophic neurites indicates that the first site of morphological damage to the intraocular RGC axon occurs in the lamina. The average number of dystrophic neurites (DNs) per EM field in the lamina was significantly higher in DBA/2J mice with no or early glaucoma compared with the no glaucoma D2-Gpnmb + controls (K, left panel, P < 0.001, t test, n = 8 eyes per genotype). This clearly demonstrates that dystrophic neurites are part of the glaucoma process and not just age-related changes. Comparing the indicated regions, the number of dystrophic neurites was highest in the lamina (P < 0.001). (L) Neurofilament and GFAP staining were used to assess serial, optic nerve cross sections extending from the nerve fiber layer at the retinal surface and into the lamina. Counting neurofilament-stained dystrophic neurites confirmed the EM findings. The values for individual DBA/2J eye show that at this age some eyes were at an early stage of glaucoma with significantly more dystrophic neurites than control mice (P < 0.001 comparing the lamina region of DBA/2J to D2-Gpnmb +; n = 9 per genotype). (A–H) Bars, 2 μm. (I–J) Bars, 20 μm.
Figure 5.
Figure 5.
Early focal axon damage occurs in the glial lamina. To allow sensitive detection of axon damage along the entire axon from the soma to the lamina we analyzed D2.Thy1-CFP eyes (Materials and methods). For consistency with previous images, CFP-positive axons are pseudo-colored green. (A) Schematic demonstrating the location in the optic nerve head of the presented prelamina and lamina images (single focal plane) that are from the same eye for each damage level. In the prelamina region, vessels are apparent as a dark region in the center of the nerve. In the lamina, the vessels extend from the center to the edge of the nerve. (B) In an 11-mo-old eye with no or early glaucoma (Fig. 3), axon damage was detected as highly focal swelling of individual axons in the lamina. As previously reported for axonal contents, CFP accumulated in the swellings making them brightly fluorescent (arrowheads). The swellings were not present in other regions of the intraocular axon. (C–K) Representative examples of the prelamina and lamina regions in eyes with different degrees of glaucoma are shown. (C, F, and I) No glaucomatous damage was detected at any level in preglaucomatous young eyes (n = 4). (D, G, and J) Obvious axonal swellings were evident specifically in the lamina of eyes that were at early stages of glaucoma. These eyes were initially classified as having no or early glaucoma based on analysis of optic nerve from behind the eye (Fig. 3), but 5/8 were found to have early damage in the lamina. (E, H, and K) At moderate stages of glaucoma, the axonal damage had spread to portions of the axon in both the prelamina region and nerve fiber layer, and some axons had a highly abnormal morphology. The compressed lamina images represent a compressed Z stack of the entire lamina region that could be imaged in the mounted specimens (it was not possible to image the most posterior lamina). All images were collected using identical conditions. Bars, 20 μm.
Figure 6.
Figure 6.
Axon degeneration is regionalized in the lamina and corresponds to fan-shaped RGC loss in the retina. (A–F) Compressed Z stack images through the lamina of DBA/2J nerves with increasing levels of glaucomatous damage (neurofilaments, green; GFAP positive glia, red). Axon loss/survival is clearly regionalized to different areas of the optic nerve and not randomly distributed. (G and H) The retina and corresponding lamina region of an eye with moderate glaucoma. Discrete fan-shaped areas of RGC loss are apparent in the retina (dotted “V,” G) and appear to correspond to two regionalized areas of axon loss in the lamina (dotted boxes, H). This is consistent with localized damage to axons within the lamina leading to fan-shaped patterns of RGC loss in the retina but it was not possible to follow the region of axon loss unambiguously through the whole optic nerve head. Bars, 50 μm.
Figure 7.
Figure 7.
Axons from surviving RGCs track to discrete regions in the glial lamina, and many other axons that survive in the eye are lost in the lamina. Proving a direct relationship between the pattern of RGC survival/loss in defined regions of the optic nerve and retina, D2.Thy1-CFP–labeled axons were found to run from RGCs surviving in individual fan-shaped regions of the retina to individual local regions in the glial lamina. Mounted tissue was optically sectioned with a confocal microscope, starting at the retinal surface and capturing images at 0.5-μm intervals from the nerve fiber layer through to the glial lamina. (A) Compressed Z stack of a retina and its optic nerve. The pseudo-colored (green, yellow, blue and red) axons on the right side travel from fan-shaped regions in the retina to discrete regions in the glial lamina. The surviving axons on the left (pseudocolored in white) travel from the retina but end just in front of the lamina, clearly showing that some axons that survive in the eye are lost in the lamina. (B) Schematic indicating positions of optical sections shown in other panels. (C and F) Compressed Z stack with outline of the optic nerve at the glial lamina denoted with a dotted ring (C, pseudo-colored; F, raw grayscale). (D and G) Single layer image within the nerve fiber layer. (E and H) Single layer image within the glial lamina with the nerve outlined by the dotted ring. The dotted line indicates the blood vessels entering the optic nerve at this level. Bars, 100 μm.
Figure 8.
Figure 8.
Axons survive up to the lamina in BAX-deficient mice with severe glaucoma. (A–I) Representative images from an EM analysis of RGC axons running from the nerve fiber layer (NFL) to lamina are shown. (A–C) Control 12-mo-old D2-Gpnmb +. Tightly packed axons (AX) are present in the nerve fiber layer, which is covered by the internal limiting membrane and footplates of Muller cells (*, A). The axons continue in an orderly arrangement through the prelamina region and into the lamina. (D–F) Age- and sex-matched DBA/2J mouse with severe glaucomatous axon loss behind the eye. In the nerve fiber layer (D), only a few damaged and swollen axons remain. Muller cells are hypertrophic and fill much of the region. Their cytoplasm, adjacent to the internal limiting membrane, is thickened (*). In the prelamina region (E), axons are largely absent and replaced by thickened glial processes. Activated astrocytes are abundant (astrocyte nucleus, N). At the lamina (F), large glial processes have replaced essentially all axons. (G–I) Age- and sex-matched D2.Bax −/− (BAX-deficient) mouse with severe axon loss behind the eye. In the nerve fiber layer (G), the axons survive but appear swollen. The Muller cell cytoplasm (*) is not hypertrophic. In the prelamina region (H), the majority of axons are intact but large swellings (arrows) are found. In contrast, in the lamina (I) essentially all axons are lost and the glia are very hypertrophic. The damage is essentially the same as that in (F). (J–L) Neurofilament labeling confirms axon survival to the proximity of the lamina in D2.Bax −/− mice. Neurofilament-labeled axons (green) in longitudinal sections of the optic nerve are shown. In a young DBA/2J mouse (J), the axons clearly gather in the nerve fiber layer at the inner edge of the optic nerve and continue to pass through to the lamina. In a 10-mo-old DBA/2J mouse with severe axon loss behind the eye (K), axons are completely missing from the nerve fiber layer and entire optic nerve. In contrast, in a 10-mo-old BAX-deficient DBA/2J mouse (L), with severe axon loss behind the eye, the axons continue to run along the retina and survive up to the proximity of the lamina (within known retraction distances following local insult; Fig. S3; Kerschensteiner et al., 2005). As was seen by EM, there is an abrupt loss of axons at the lamina. Despite axon survival up to thelamina, the optic nerve head has still remodeled (become excavated) and so the morphology is not directly comparable to the control. Importantly, this pattern of axon survival up to the lamina provides strong experimental evidence for a direct insult to the axon at this location in this inherited glaucoma (see Fig. S3 for higher magnification images of J and L). (A, D, and G) Bar, 2 μm. All other EM bars, 500 nm. (J–L) Bar, 75 μm.
Figure 9.
Figure 9.
Wlds profoundly protects from glaucomatous damage. (A) The IOP distributions of mice of each genotype overlap extensively. The boxes show the upper and lower quartiles and the bars show the extremes including outliers. The centerline of each diamond is the mean and the upper and lower points of each diamond represent the 95% confidence intervals of the mean. Mice with a single copy of the Wlds fusion gene are hemizygous (Hemi). At both 9 and 12 mo, there were no significant differences in IOP (ANOVA) between the neuroprotected, Wlds mice (see below), and mice of any other genotype. At 10.5 mo, the wild-type (WT) mice had an unusually high skewing of their IOP compared with typical values at this age (see Anderson et al., 2005; Libby et al., 2005a), and their IOP was significantly higher than mice of all other genotypes (P < 0.04 for all comparisons). This skewing did not account for the decreased axon loss in Wlds mice. This is clear because (1) there was extensive overlap between all genotypes, and (2) the IOP distribution of Wlds mice was extremely similar (P = 0.7) to Bax +/− heterozygotes mice (Het), whose axons were not protected (see below). (B) Axon protection in Wlds mice. Distributions of optic nerve damage in mice of the indicated genotypes are shown at two important time points (Materials and methods). The Wlds allele significantly rescues axons from glaucomatous degeneration at 12 mo of age (P < 0.0001, chi square comparing Wlds Hemi to their WT littermates). Importantly, Wlds increased the number of eyes with no detectable glaucoma. Bax +/− heterozygosity conferred no protective effect when compared with wild-type mice (right). Though not statistically significant, there tended to be a greater degree of protection in D2.WldsBax +/− double mutants (right), compared with Wlds single mutants (left). The number of eyes analyzed for each genotype at 10.5 mo was typically ≥40 but 20 for D2.Bax +/− heterozygotes. At 12 mo, typically ≥63 eyes were studied for each genotype but 21 for D2.Bax +/− heterozygotes. (C–F) Wlds preserves RGC axons and optic nerve morphology as seen in semi-thin sections. Most wild-type (C) and D2.Bax +/− nerves (E) had severe glaucoma with very substantial axon loss (see Fig. 3) and extensive glial scarring. In contrast, the majority of D2.Wlds (D) and D2.WldsBax +/− nerves (F) had no or early glaucoma, with <5% of axons damaged (Fig. 3) and no evidence of glial hypertrophy or scarring. (G) Axon counts for a randomly selected sample of DBA/2J and D2.Wlds nerves with no or early glaucoma (n = 6 for each genotype). The averages are not statistically different (P = 0.235), and none of the D2.Wlds nerves had decreased axon counts. Because Wlds more than doubled the number of eyes with no or early glaucoma, half of these counted eyes were rescued. (H–J) Retinal flatmounts showing that in Wlds protected eyes RGC somata survive (H, preglaucoma; I, severe glaucoma; J, no or early glaucoma). (K) This was confirmed by counting RGC layer cells in eyes with no or early glaucoma. Again, half of the D2-Wlds eyes were rescued and none had cell numbers below the range of wild-type values (n = 10 each genotype, P > 0.1). As expected, in both wild-type and D2.Wlds mice with severe optic nerve damage the majority of RGCs were lost. The retinal images shown are from a matched region of the superior, peripheral retina. (L) Despite the profound rescue, a mild degree of somal shrinkage (∼10%) was seen in D2.Wlds eyes with no detectable glaucoma. The shrinkage appears to occur generally across cells of different sizes (see Fig. S4). (M) Wlds strongly preserved PERG amplitude, a measure of RGC activity, in randomly selected mice (number of eyes = 16, 14, 18 for D2-Gpnmb+, DBA/2J, and D2.Wlds, respectively). Bars, 100 μm.

References

    1. Adalbert, R., T.H. Gillingwater, J.E. Haley, K. Bridge, B. Beirowski, L. Berek, D. Wagner, D. Grumme, D. Thomson, A. Celik, et al. 2005. A rat model of slow Wallerian degeneration (WldS) with improved preservation of neuromuscular synapses. Eur. J. Neurosci. 21:271–277. - PubMed
    1. Anderson, D.R. 1969. Ultrastructure of human and monkey lamina cribrosa and optic nerve head. Arch. Ophthalmol. 82:800–814. - PubMed
    1. Anderson, D.R. 1973. Ascending and descending optic atrophy produced experimentally in squirrel monkeys. Am. J. Ophthalmol. 76:693–711. - PubMed
    1. Anderson, D.R., and A. Hendrickson. 1974. Effect of intraocular pressure on rapid axoplasmic transport in monkey optic nerve. Invest. Ophthalmol. 13:771–783. - PubMed
    1. Anderson, D.R., and A.E. Hendrickson. 1977. Failure of increased intracranial pressure to affect rapid axonal transport at the optic nerve head. Invest. Ophthalmol. Vis. Sci. 16:423–426. - PubMed

Publication types

MeSH terms

Substances