. 2007 Dec 28;28(6):1045-57.
doi: 10.1016/j.molcel.2007.12.005.

Distinct roles of chromatin-associated proteins MDC1 and 53BP1 in mammalian double-strand break repair

Affiliations

Distinct roles of chromatin-associated proteins MDC1 and 53BP1 in mammalian double-strand break repair

Anyong Xie et al. Mol Cell. .

Abstract

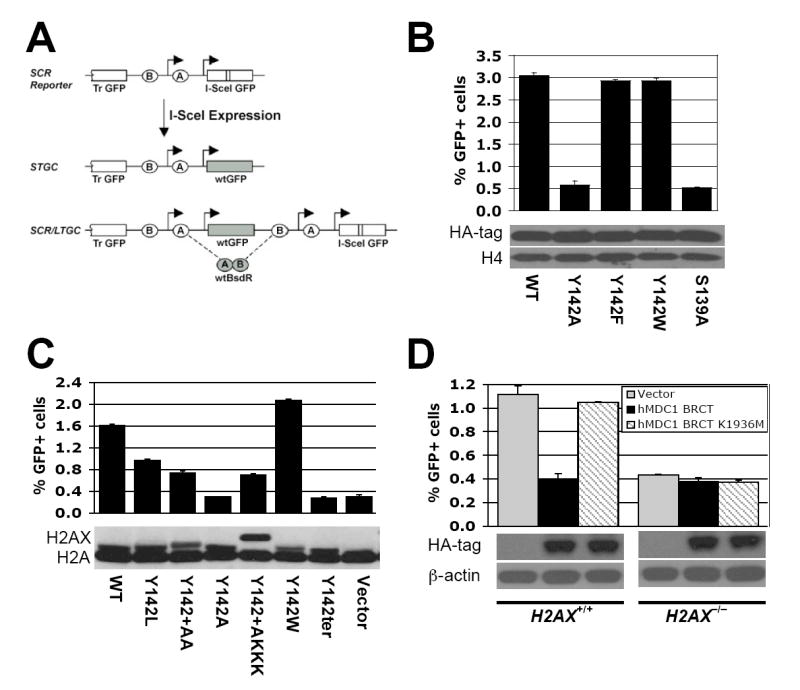
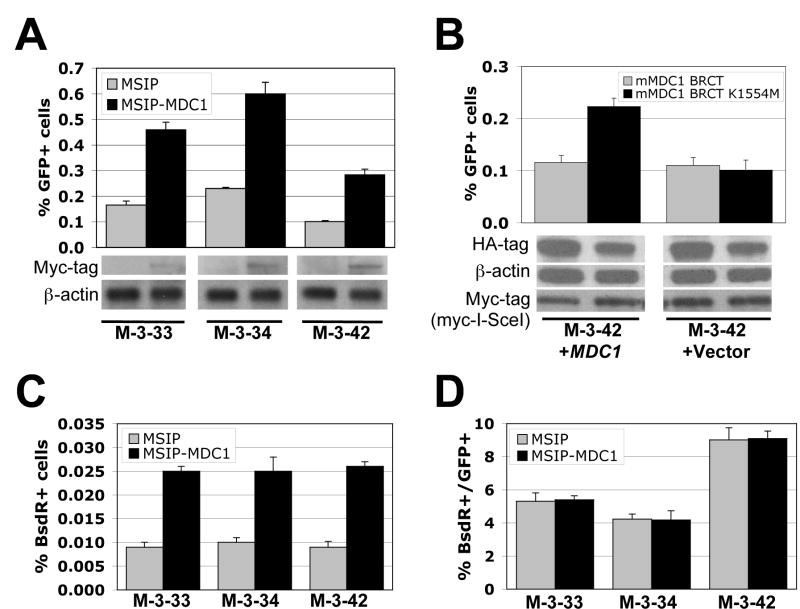
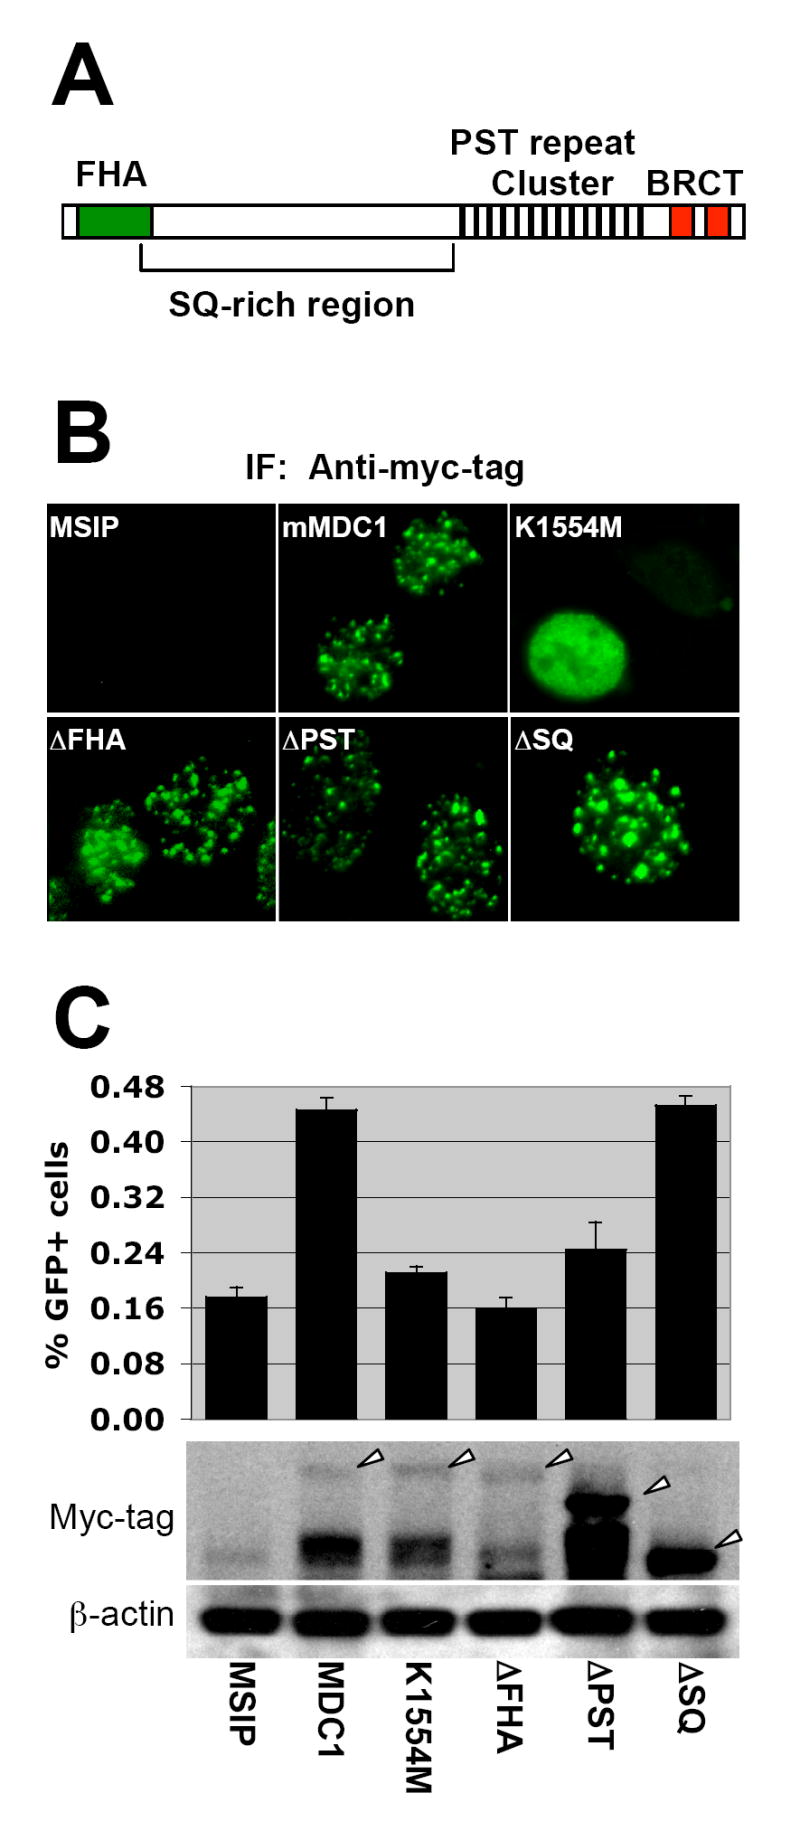
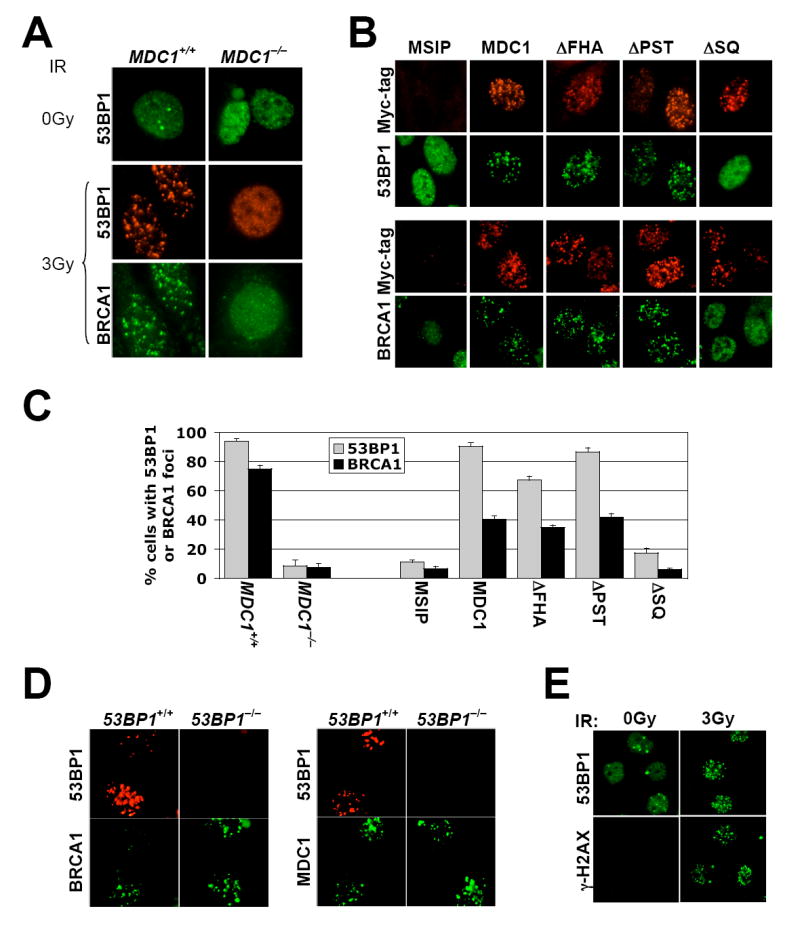
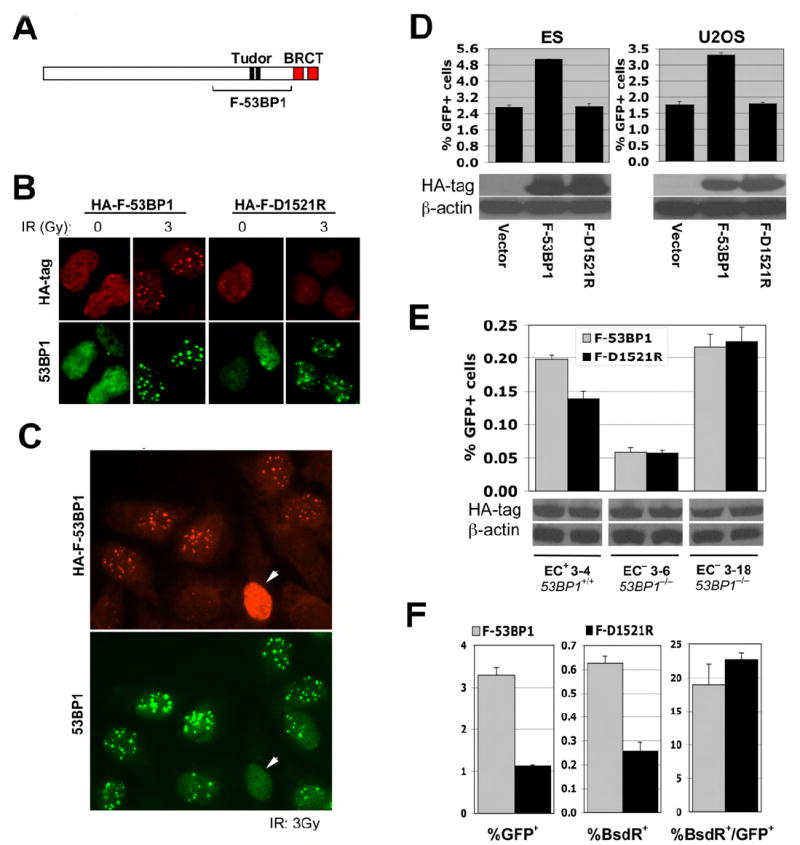
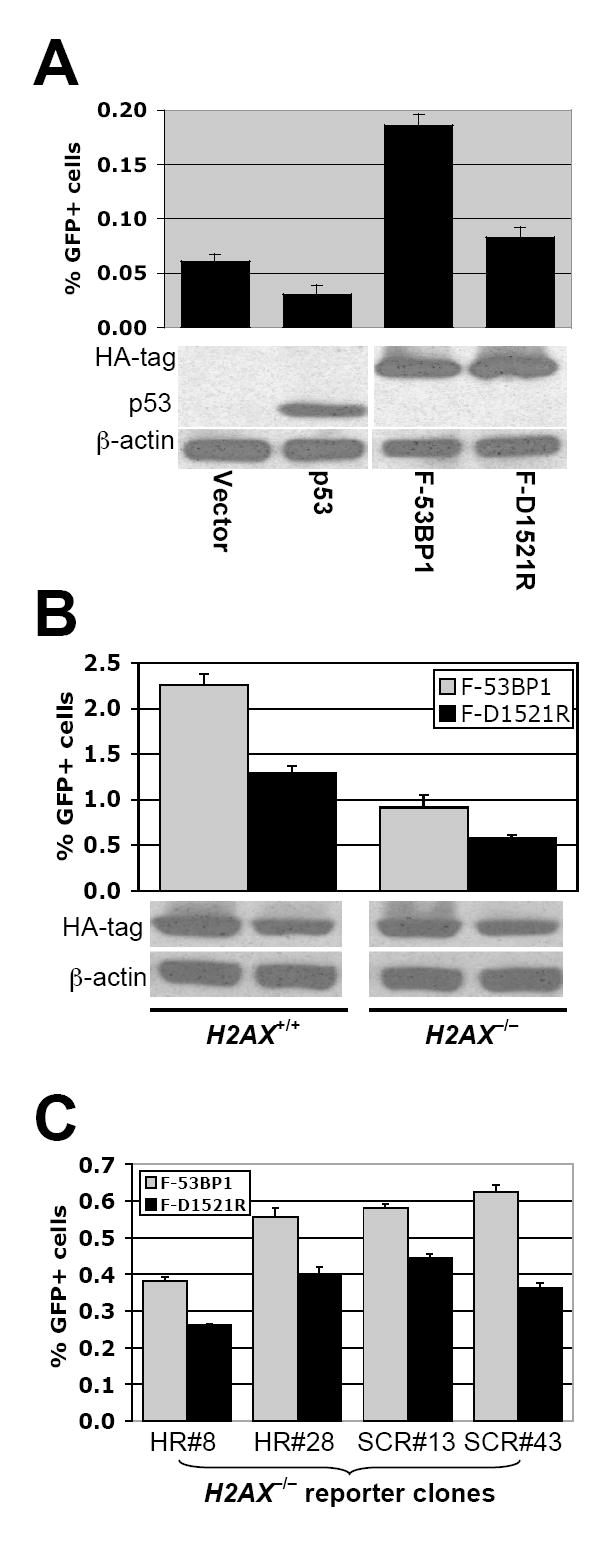
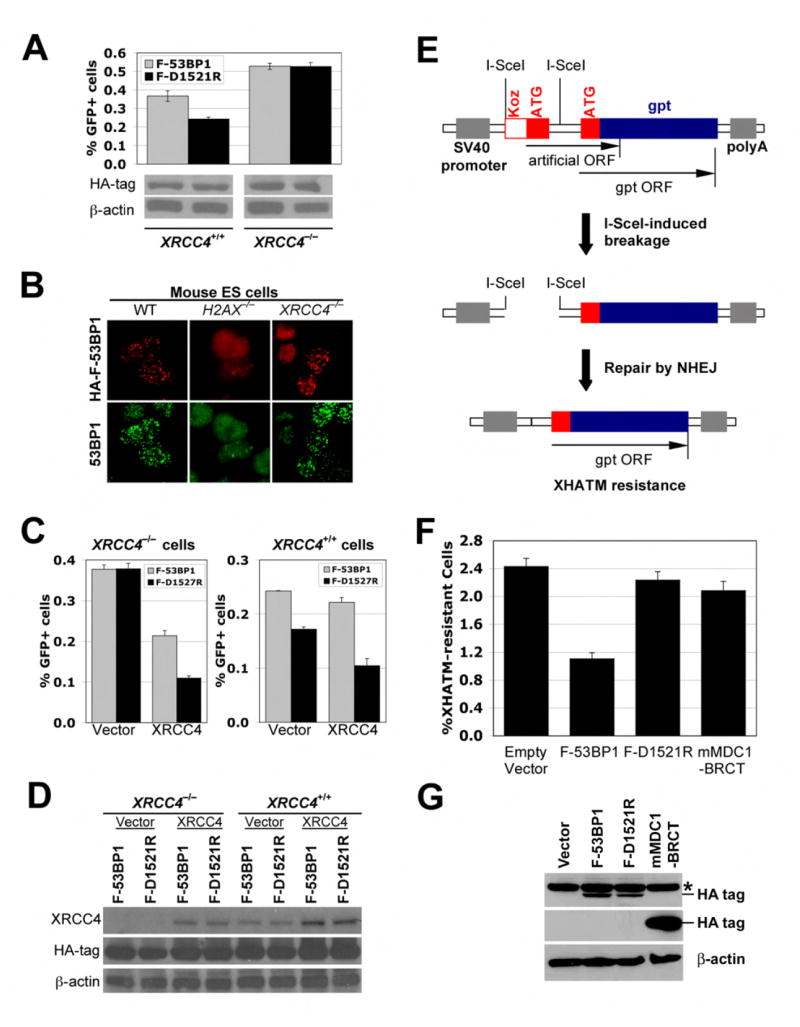
Phosphorylated histone H2AX ("gamma-H2AX") recruits MDC1, 53BP1, and BRCA1 to chromatin near a double-strand break (DSB) and facilitates efficient repair of the break. It is unclear to what extent gamma-H2AX-associated proteins act in concert and to what extent their functions within gamma-H2AX chromatin are distinct. We addressed this question by comparing the mechanisms of action of MDC1 and 53BP1 in DSB repair (DSBR). We find that MDC1 functions primarily in homologous recombination/sister chromatid recombination, in a manner strictly dependent upon its ability to interact with gamma-H2AX but, unexpectedly, not requiring recruitment of 53BP1 or BRCA1 to gamma-H2AX chromatin. In contrast, 53BP1 functions in XRCC4-dependent nonhomologous end-joining, likely mediated by its interaction with dimethylated lysine 20 of histone H4 but, surprisingly, independent of H2AX. These results suggest a specialized adaptation of the "histone code" in which distinct histone tail-protein interactions promote engagement of distinct DSBR pathways.


Figures

Figure 1
Figure 1. γ-H2AX HR function correlates with MDC1 binding
(A). Structure of the HR/SCR reporter. Ovals “A” and “B” depict artificial 5’ and 3’ BsdR exons, respectively. Arrows indicate promoters. “Tr-GFP”: 5’truncated GFP. (B). I-SceI induced GFP+ frequencies in H2AX−/− HR/SCR reporter ES cells, transiently transfected with HA-tagged human H2AX expression plasmids. Bars represent mean of triplicate samples. Error bars indicate standard error of the mean (SEM). Paired t-test between “Y142A” and “WT” or “Y142F”: P < 0.1%; between “Y142A” and “Y142W”: P < 0.3%; between “WT” and “Y142F” or “Y142W”: not significant (NS). Levels of H2AX proteins are shown under corresponding lanes. (C). I-SceI induced GFP+ frequencies in H2AX−/− HR/SCR reporter ES cells, transiently transfected with mouse H2AX expression plasmids. Bars represent mean of triplicate samples. Error bars indicate SEM. Paired t-test between “WT” and “Y142A” or “Y142ter”: P < 0.03%; between “WT” and the remaining samples: P < 0.4%; between “Y142W” and any other samples except “WT”: P < 0.2%. Levels of H2AX proteins (visualized using anti-H2A Ab) are shown under corresponding lanes. (D). I-SceI-induced HR in H2AX+/+ and H2AX−/− HR/SCR reporter ES cells, transiently transfected with empty vector, HA-tagged human MDC1 BRCT or MDC1 BRCT K1936M expression plasmids. Bars represent mean of triplicate samples. Error bars indicate SEM. Paired t-test in H2AX+/+ between “hMDC1 BRCT” and “Vector”: P < 2.67%; between “hMDC1 BRCT” and “hMDC1 BRCT K1936M”: P < 0.65%. Same comparisons in H2AX−/− cells: NS. Levels of MDC1 BRCT proteins are shown under the chart.
Figure 2
Figure 2. MDC1 regulates sister chromatid recombination
(A). I-SceI induced GFP+ frequencies in three MDC1-/- HR/SCR reporter clones stably expressing empty vector MSIP or myc-tagged mouse wtMDC1. Bars represent mean of triplicate samples. Error bars indicate SEM. Paired t-test between “MSIP” and “MSIP-MDC1”: P < 1.59% for M-3-33, P < 0.78% for M-3-34, and P < 0.95% for M-3-42. Myc-MDC1 protein levels are shown under the corresponding lane. (B). I-SceI-induced GFP+ frequencies in MDC1−/− MEF M-3-42 reporter cells stably expressing myc-tagged mouse MDC1 or empty vector, transiently transfected with myc-tagged mouse wt MDC1 BRCT or MDC1 BRCT K1554M expression plasmids. Bars represent mean of triplicate samples. Error bars indicate SEM. Paired t-test between “mMDC1 BRCT” and “mMDC1 BRCT K1554M”: P < 2.23% in “M-3-42+MDC1” and NS in “M-3-42+Vector”. Levels of HA-MDC1 BRCT proteins and myc-tagged I-SceI are shown under the chart. (C). I-SceI-induced BsdR+ frequencies in the same experiment shown in (A). Paired t-test between “MSIP” and “MSIP-MDC1”: P < 0.61% for M-3-33, P < 2.76% for M-3-34, and P < 1.56% for M-3-42. (D). Ratio of I-SceI-induced BsdR+ to I-SceI-induced GFP+ frequency from the same experiments shown in (A) and (C). Difference between “MSIP” and “MSIP-MDC1” in each clone: NS.
Figure 3
Figure 3. MDC1 domains required for HR
(A). Schematic representation of MDC1 protein. (B). MDC1 IRIF formation in MDC1−/− cells stably expressing myc-tagged mouse wtMDC1 or mutant MDC1 alleles. Cells received 3Gy of IR. (C). I-SceI induced GFP+ frequencies in MDC1−/− MEF reporter cells stably expressing myc-tagged mouse wtMDC1 or mutant MDC1 alleles. Bars represent mean of triplicate samples. Error bars indicate SEM. Paired t-test between “MDC1” and “MSIP”: P < 1.26%; between “K1554M” and “MDC1”: P < 0.65%; between “ΔFHA” and “MDC1”: P < 0.47%; between “ΔPST” and “MDC1”: P < 3.52%; between “ΔSQ” and “MDC1”: NS. Levels of MDC1 proteins are shown under corresponding chart. Arrowheads indicate full-length proteins.
Figure 4
Figure 4. MDC1 domains required for IRIF formation by 53BP1 and BRCA1
(A). IRIF of 53BP1 and BRCA1 in MDC1+/+ MEF cells or MDC1−/− MEF cells. IR doses were as shown. (B). IRIF of 53BP1 and BRCA1 in MDC1−/− MEF cells stably expressing myc-tagged mouse wtMDC1 or mutant MDC1 alleles as indicated. Cells received 3Gy of IR. (C). Statistical evaluation of the experiments shown in (A and B). Nuclei containing more than five 53BP1 foci or ten BRCA1 foci were scored as positive for IRIF. >150 cells were analyzed for each MDC1 allele indicated. Paired t-test for both 53BP1 foci and BRCA1 foci between MDC1+/+ cells and MDC1−/− cells: P < 0.00014%; between “MSIP” and “MDC1”, “ΔFHA”, or “ΔPST”: P < 0.01%; between “MSIP” and “ΔSQ” or between “MDC1” and “ΔFHA” or “ΔPST”: NS. (D). BRCA1 and 53BP1 IRIF in 53BP1+/+ or 53BP1-/- mouse EC cells. Cells received 3Gy of IR. (E). 53BP1 and γ-H2AX IRIF in BRCA1 mutant HCC1937 cells (IR doses as shown).
Figure 5
Figure 5. Inhibition of 53BP1/H4K20me2 interaction stimulates HR
(A). Schematic representation of 53BP1. The tandem Tudor domain, tandem BRCT domain and the region comprising F-53BP1 are indicated. (B). IRIF of endogenous 53BP1 and of transiently expressed HA-F-53BP1 or HA-F-D1521R in U2OS cells (upper panel). IR doses as shown. (C). High levels of F-53BP1 disrupt IRIF by endogenous 53BP1 (marked with arrowhead). Cells received 3Gy of IR. (D). I-SceI-induced GFP+ frequencies in mouse ES and U2OS HR/SCR reporter cells, as indicated, transiently transfected with empty vector, HA-F-53BP1 or HA-F-D1521R expression plasmids. Bars represent mean of triplicate samples. Error bars indicate SEM. Paired t-test between “F-53BP1” and “Vector”: P < 0.08% in ES cells and P < 0.9% in U2OS cells; between “F-53BP1” and “F-D1521R”: P < 0.2% in ES cells and P < 0.4% in U2OS cells. Levels of HA-F-53BP1 and HA-F-D1521R proteins are shown under the chart. (E). I-SceI induced GFP+ frequencies in 53BP1+/+ and 53BP1−/− mouse HR/SCR reporter EC cells, transiently transfected with HA-F-53BP1 or HA-F-D1527R expression plasmids. Bars represent mean of triplicate samples. Error bars indicate SEM. Paired t-test between “F-53BP1” and “F-D1521R” in EC+ 3-4 cells: P < 0.5%; in EC 3-6 and EC 3-18 cells: NS. Steady state levels of HA-F-53BP1 and HA-F-D1521R proteins are shown under the chart. (F). I-SceI-induced GFP+ frequencies (left panel), BsdR+ frequencies (middle panel), and ratio of BsdR+ to GFP+ frequency (right panel) in U2OS reporter cells, transiently transfected with HA-F-53BP1 or HA-F-D1521R expression plasmids. Bars represent mean of triplicate samples. Error bars indicate SEM. Paired t-test between “F-53BP1” and “F-D1521R”: P < 0.6% for GFP+ frequencies, P < 0.5% for BsdR+ frequencies, and NS for the ratio of GFP+:BsdR+ frequency.
Figure 6
Figure 6. “HR suppression” function of 53BP1 does not require H2AX
(A). I-SceI-induced GFP+ frequencies in HCC1937 HR/SCR reporter cells (p53−/−BRCA1 mutant), transiently transfected with expression plasmids as indicated. Bars represent mean of triplicate samples. Error bars indicate SEM. Paired t-test between “p53” and “Vector”: NS; between “F-53BP1” and “Vector”: P < 1.2%; between “F-53BP1” and “F-D1521R”: P < 0.04%. Levels of transiently transfected proteins are shown under the chart. (B). I-SceI induced GFP+ frequencies in H2AX+/+ and H2AX−/− ES HR/SCR reporter cells transiently transfected with HA-F-53BP1 or HA-F-D1521R expression plasmids. Bars represent mean of triplicate samples. Error bars indicate SEM. Paired t-test between “F-53BP1” and “F-D1521R”: P < 0.3% in H2AX+/+, and P < 1.6% in H2AX−/− cells. Levels of HA-F-53BP1 and HA-F-D1521R proteins are shown under the chart. (C). I-SceI induced GFP+ frequencies in four additional H2AX−/− ES HR reporter clones transiently transfected with HA-F-53BP1 or HA-F-D1521R expression plasmids. Each clone containing either the HR reporter or the HR/SCR reporter is indicated. Bars represent mean of triplicate samples. Error bars indicate SEM. Paired t-test between “F-53BP1” and “F-D1521R”: P < 1.55% in HR#8, P < 1.20% in HR#28, P < 1.62% in SCR#13, and P < 0.50% in SCR#43.
Figure 7
Figure 7. 53BP1 mediates XRCC4-dependent NHEJ
(A). I-SceI induced GFP+ frequencies in isogenic XRCC4+/+ and XRCC4−/− ES cells containing the HR/SCR reporter, transiently transfected with HA-F-53BP1 or HA-F-D1521R expression plasmids. Bars represent mean of triplicate samples. Error bars indicate SEM. Paired t-test between “F-53BP1” and “F-D1521R”: P < 1.2% in XRCC4+/+ cells, and NS in XRCC4−/− cells. Levels of HA-F-53BP1 and HA-F-D1521R proteins are shown under the chart. (B). IRIF of HA-F-53BP1 and endogenous 53BP1 in wild-type, H2AX-/- or XRCC4-/- ES cells transiently transfected with expression plasmids for HA-F-53BP1. Cells received 3Gy of IR. (C). I-SceI induced GFP+ frequencies in isogenic XRCC4−/− and XRCC4+/+ HR/SCR reporter ES cells transiently co-transfected with XRCC4 expression plasmid and HA-F-53BP1 or HA-F-D1521R expression plasmids. Bars represent mean of triplicate samples. Error bars indicate SEM. Paired t-test between “F-53BP1” and “F-D1521R” in XRCC4−/− cells: P < 0.7% with XRCC4 expression plasmids and NS with Vector. In XRCC4+/+ cells: P < 0.5% with Vector and P < 3.1% with XRCC4 expression plasmids. (D). Levels of XRCC4, HA-F-53BP1 and HA-F-D1521R proteins in HR/SCR reporter ES cells shown in (C). (E). Chromosomal NHEJ substrate pPHW2 (Dahm-Daphi et al., 2005). Translation of an artificial ORF (Koz-ATG) dominates over that of gpt. Simultaneous cleavage of both I-SceI sites causes “pop-out” of the intervening sequence. Repair by NHEJ allows expression of gpt, making cells resistant to XHATM. (F). I-SceI induced XHATMR frequencies in MEFs containing a single copy of integrated NHEJ reporter (Dahm-Daphi et al., 2005), transiently transfected with the I-SceI expression plasmid and either empty vector, HA-F-53BP1, HA-F-D1527R, or HA-mMDC1 BRCT expression plasmids. Data shown is corrected for plating efficiency and transfection efficiency. Bars represent mean of triplicate samples; error bars indicate SEM. Paired t-test between “empty vector” and “F-53BP1”: P < 0.3%; between “F-53BP1” and “F-D1521R”: P < 2%; between “empty vector” and “mMDC1 BRCT”: NS. (G). Levels of HA-tagged proteins transiently expressed in NHEJ reporter MEF cells shown in (F). Asterisk marks background band.

References

    1. Adams MM, Carpenter PB. Tying the loose ends together in DNA double strand break repair with 53BP1. Cell Div. 2006;1:19. - PMC - PubMed
    1. Bassing CH, Chua KF, Sekiguchi J, Suh H, Whitlow SR, Fleming JC, Monroe BC, Ciccone DN, Yan C, Vlasakova K, et al. Increased ionizing radiation sensitivity and genomic instability in the absence of histone H2AX. Proc Natl Acad Sci U S A. 2002;99:8173–8178. - PMC - PubMed
    1. Bassing CH, Suh H, Ferguson DO, Chua KF, Manis J, Eckersdorff M, Gleason M, Bronson R, Lee C, Alt FW. Histone H2AX: a dosage-dependent suppressor of oncogenic translocations and tumors. Cell. 2003;114:359–370. - PubMed
    1. Botuyan MV, Lee J, Ward IM, Kim JE, Thompson JR, Chen J, Mer G. Structural basis for the methylation state-specific recognition of histone H4-K20 by 53BP1 and Crb2 in DNA repair. Cell. 2006;127:1361–1373. - PMC - PubMed
    1. Celeste A, Fernandez-Capetillo O, Kruhlak MJ, Pilch DR, Staudt DW, Lee A, Bonner RF, Bonner WM, Nussenzweig A. Histone H2AX phosphorylation is dispensable for the initial recognition of DNA breaks. Nat Cell Biol. 2003;5:675–679. - PubMed

Publication types

MeSH terms