

Item Response Analysis of the Inventory of Depressive Symptomatology
- PMID: 18159226
- PMCID: PMC2151759
- DOI: 10.2147/nedt.2006.2.4.557
Item Response Analysis of the Inventory of Depressive Symptomatology
Abstract
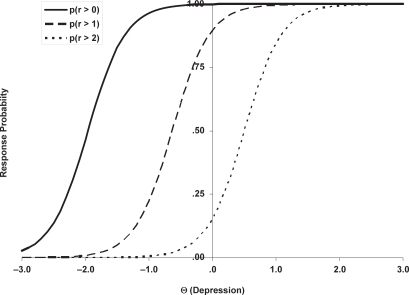
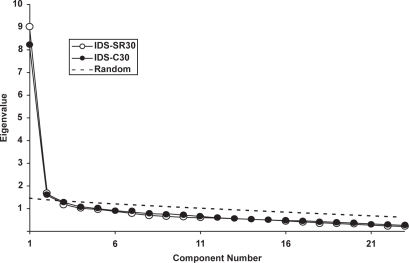
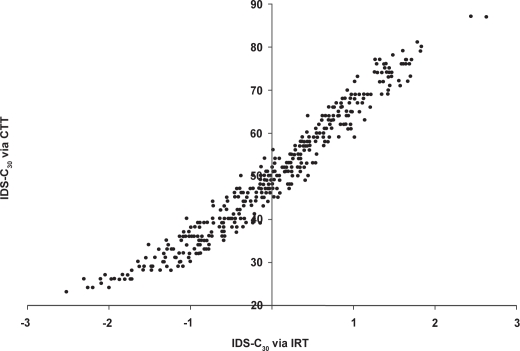
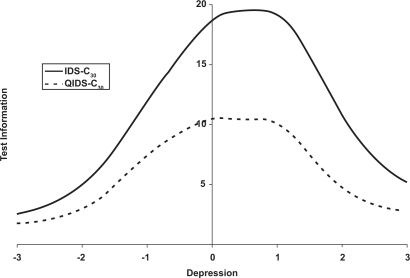
BACKGROUND: Both the clinician (IDS-C(30)) and self-report (IDS-SR(30)) versions of the 30-item Inventory of Depressive Symptomatology have acceptable psychiatric properties and have been used in various clinical studies. These two scales, however, have not been compared using item response theory (IRT) methods to determine whether the standard scoring methods are optimal. METHODS: Data were derived from 428 adult public sector outpatients with nonpsychotic major depressive disorder. The IDS-C(30) and IDS-SR(30) were compared using Samejima's graded response model. RESULTS: A model was constructed jointly fitting the IDS-C(30) and IDS-SR(30). An improvement in scale performance was obtained by grouping selected items into domains (specifically sleep, psychomotor, and appetite/weight domains) analogous to the standard scoring of the 16-item Quick Inventory of Depressive Symptomatology. CONCLUSIONS: For the IDS-C(30) and IDS-SR(30), standard scoring (ie, computing total score using all individual items) provides simplicity, comparability to published data, and a basis for clinical decision making. The revised scoring method, however, improves the utility of both scales when comparing groups as it provides explicit tests of item parameters.
Figures
References
-
- [APA] American Psychiatric Association . Diagnostic and Statistical Manual of Mental Disorders. 4th ed. Washington DC: APA; 2000. text revision.
Grants and funding
LinkOut - more resources
Full Text Sources
Research Materials
