. 2007 Dec;3(12):e248.
doi: 10.1371/journal.pcbi.0030248.

Determinants of protein abundance and translation efficiency in S. cerevisiae

Affiliations

Determinants of protein abundance and translation efficiency in S. cerevisiae

Tamir Tuller et al. PLoS Comput Biol. 2007 Dec.

Abstract

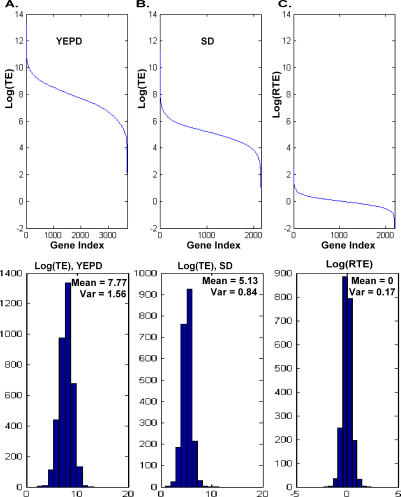
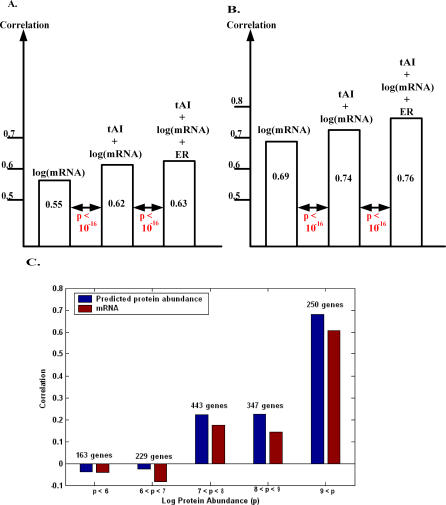
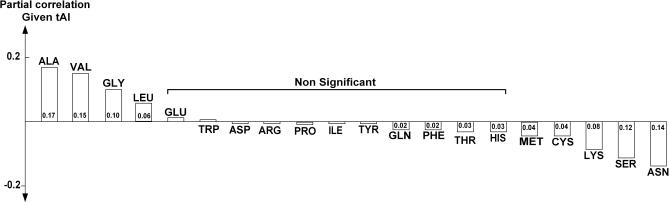
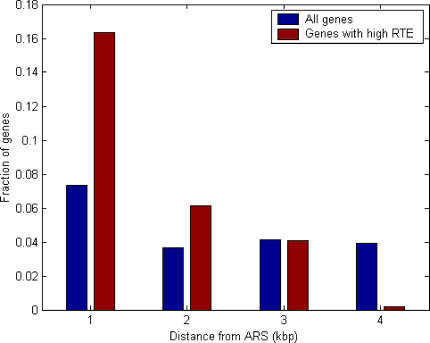
The translation efficiency of most Saccharomyces cerevisiae genes remains fairly constant across poor and rich growth media. This observation has led us to revisit the available data and to examine the potential utility of a protein abundance predictor in reinterpreting existing mRNA expression data. Our predictor is based on large-scale data of mRNA levels, the tRNA adaptation index, and the evolutionary rate. It attains a correlation of 0.76 with experimentally determined protein abundance levels on unseen data and successfully cross-predicts protein abundance levels in another yeast species (Schizosaccharomyces pombe). The predicted abundance levels of proteins in known S. cerevisiae complexes, and of interacting proteins, are significantly more coherent than their corresponding mRNA expression levels. Analysis of gene expression measurement experiments using the predicted protein abundance levels yields new insights that are not readily discernable when clustering the corresponding mRNA expression levels. Comparing protein abundance levels across poor and rich media, we find a general trend for homeostatic regulation where transcription and translation change in a reciprocal manner. This phenomenon is more prominent near origins of replications. Our analysis shows that in parallel to the adaptation occurring at the tRNA level via the codon bias, proteins do undergo a complementary adaptation at the amino acid level to further increase their abundance.


Conflict of interest statement

Competing interests. The authors have declared that no competing interests exist.

Figures

Figure 1
Figure 1. Distribution of TE and RTE in S. cerevisiae
(A) Top: S. cerevisiae genes sorted by their TE (log scale) in YEPD (rich) medium. A large variability of TE values (more than six orders of magnitude) is observed. Bottom: histogram, mean, and variance of TE in YEPD. (B) Top: S. cerevisiae genes sorted by their TE (log scale) in SD (poor) medium. A similar large variability of TE values is seen. Bottom: histogram, mean, and variance of TE in SD. (C) Top: S. cerevisiae genes sorted by the log-ratio of their TEs [RTE = (pSD/mSD)/(pYEPD/mYEPD)] in SD versus YEPD (log scale). A total of 91% of the genes have an RTE value between 0.5 and 2. Bottom: histogram, mean, and variance of RTE.
Figure 2
Figure 2. Performances of the Linear Predictor of (log) Protein Abundance
(A) The accuracy of various linear predictors of (log) protein abundance, measured by the Spearman rank correlation coefficient over a held-out test set, using a single data source of protein abundance [2] and mRNA levels [15]. ER values are from [19], and tAI data are taken from [20]. The numbers below the arrows denote the t-test p-values for checking the null hypothesis that the predictor with the new added feature has identical performance to its predecessor (see Methods). The final predictor for protein abundance (PA) is log(PA) = 3.97 + 0.4 × log(mRNA) + 10.34 × tAI − 3.35 × ER. (B) Accuracy of various linear predictors, in the case where protein and mRNA levels are generated by averaging measurements from at least two data sources. The final predictor for protein abundance obtained in this case is log(PA) = 3.47 + 0.63 × log(mRNA) + 10.89 × tAI − 2.923 × ER. (C) The Spearman correlations (y-axis) of predicted protein abundance (mRNA) with measured protein abundance levels, binned at various levels of protein abundance p (x-axis, natural log). All the correlations are higher and significant in the case of predicted protein abundance (p < 2 × 10⁻⁵), except for the lowest bin log(p) < 7.
Figure 3
Figure 3. Partial Correlations between the Frequencies of Amino Acids Composing a Protein and Its Abundance Level (after Controlling for the Effect of tAI)
Figure 4
Figure 4. The Distribution of Genes with High RTEs at Different Distances from Origins of Replication
The distribution of genes with high RTE (RTE > 2.5), and distribution of all genes at different distances from origins of replication. The number of genes with high RTE is 49; the total number of genes studied is 2,200. The number of genes with high RTE that are located within 1 kbp from an ARS is statistically significant using a hyper-geometric text (p < 0.05).

References

    1. Brazma A, Parkinson H, Sarkans U, Shojatalab M, Vilo J, et al. Arrayexpress—A public repository for microarray gene expression data at the EBI. Nucleic Acids Res. 2003;31:68–71. - PMC - PubMed
    1. Ghaemmaghami S, Huh WK, Bower K, Howson RW, Belle A, et al. Global analysis of protein expression in yeast. Nature. 2003;425:737–741. - PubMed
    1. Greenbaum D, Colangelo C, Williams K, Gerstein M. Comparing protein abundance and mRNA expression levels on a genomic scale. Genome Biol. 2003;4:1–8. - PMC - PubMed
    1. Greenbaum D, Jansen R, Gerstein M. Analysis of mRNA expression and protein abundance data: An approach for the comparison of the enrichment of features in the cellular population of proteins and transcripts. Bioinformatics. 2002;18:585–596. - PubMed
    1. Newman JRS, Ghaemmaghami S, Ihmels J, Breslow DK, Noble M, et al. Single-cell proteomic analysis of S. Cerevisiae reveals the architecture of biological noise. Nature. 2006;441:840–846. - PubMed

Publication types

MeSH terms

Substances

LinkOut - more resources