. 2007 Dec 28;131(7):1327-39.
doi: 10.1016/j.cell.2007.11.039.

STIM2 is a feedback regulator that stabilizes basal cytosolic and endoplasmic reticulum Ca2+ levels

Affiliations

STIM2 is a feedback regulator that stabilizes basal cytosolic and endoplasmic reticulum Ca2+ levels

Onn Brandman et al. Cell. .

Abstract

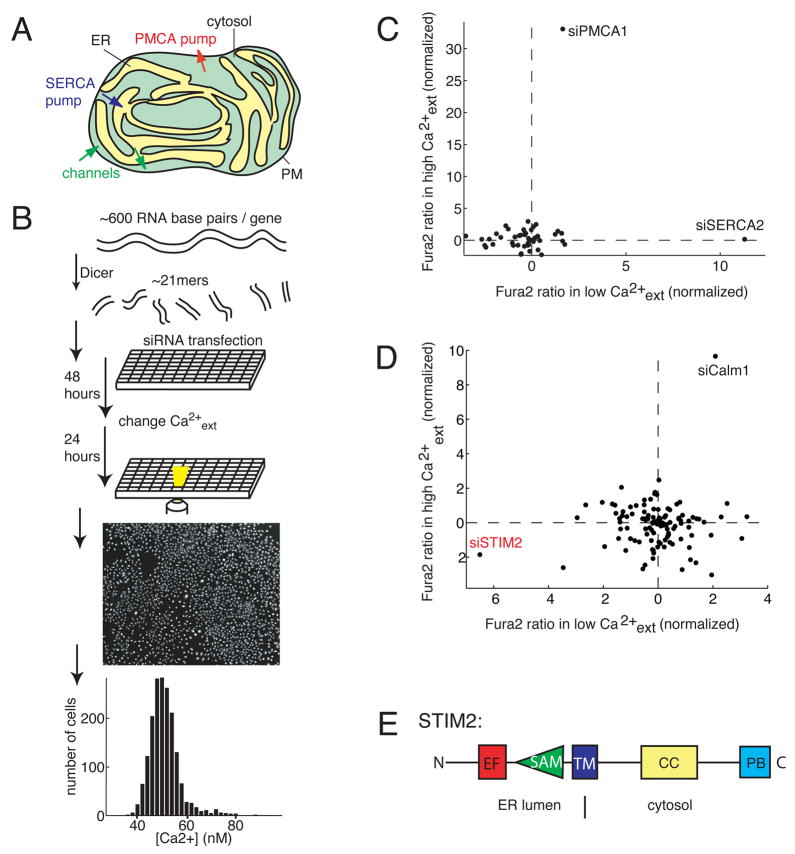
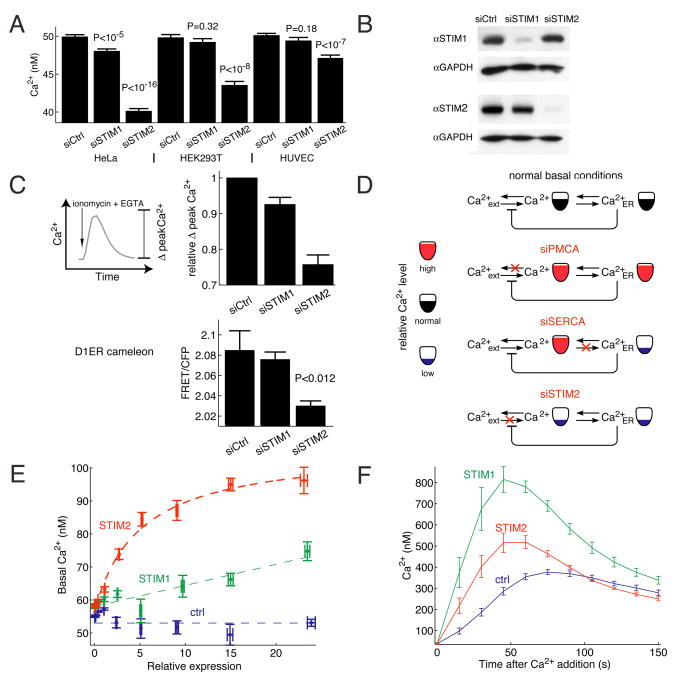
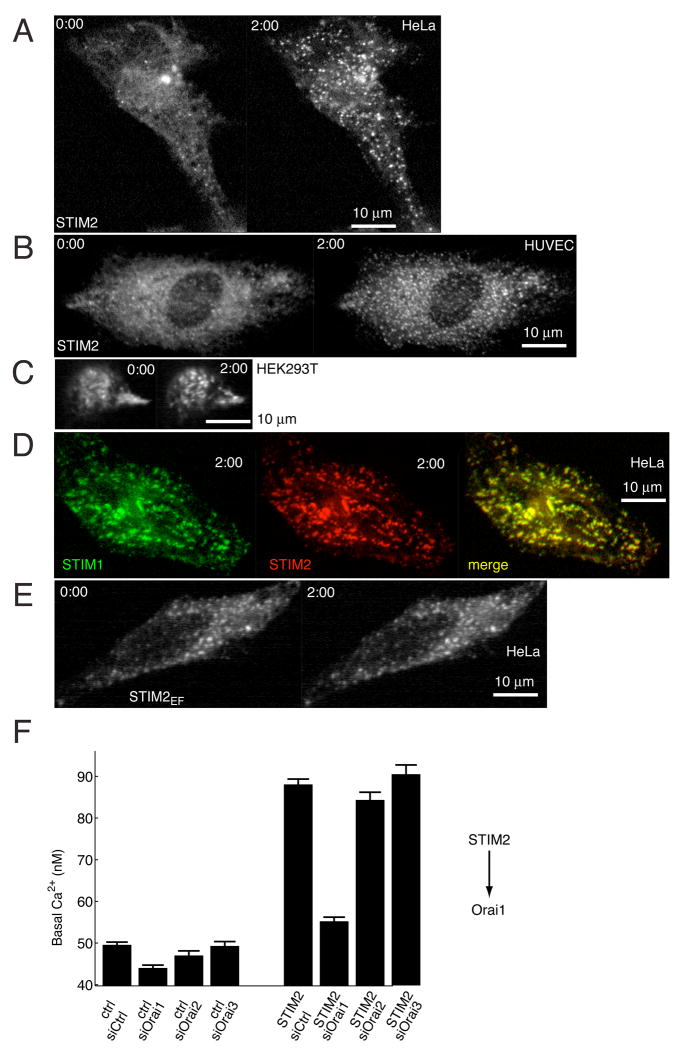
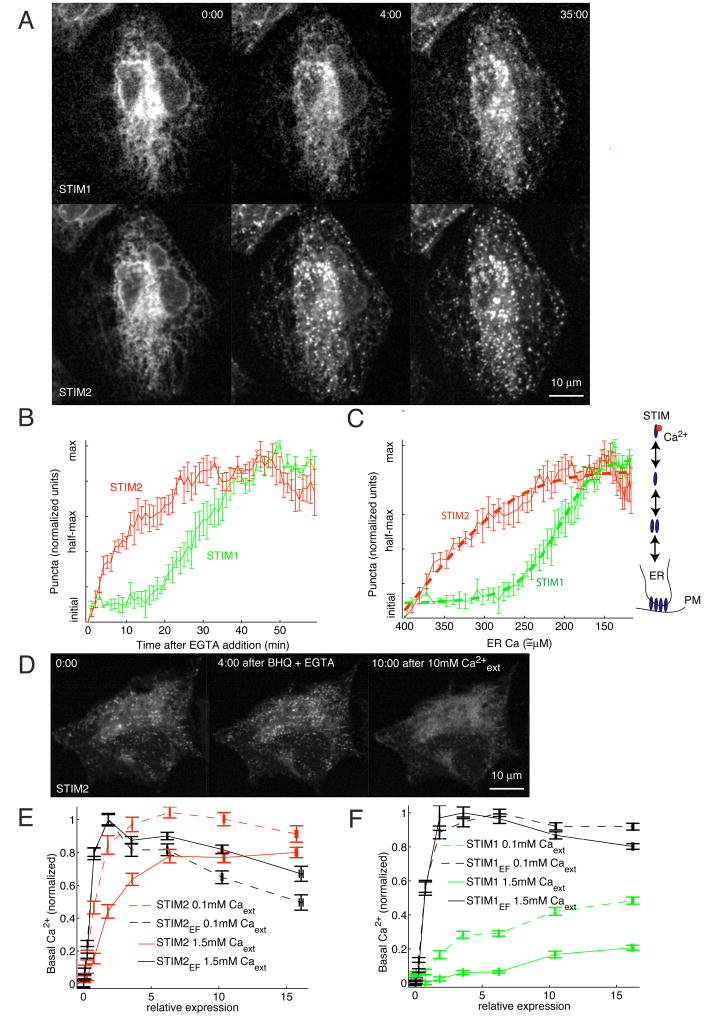
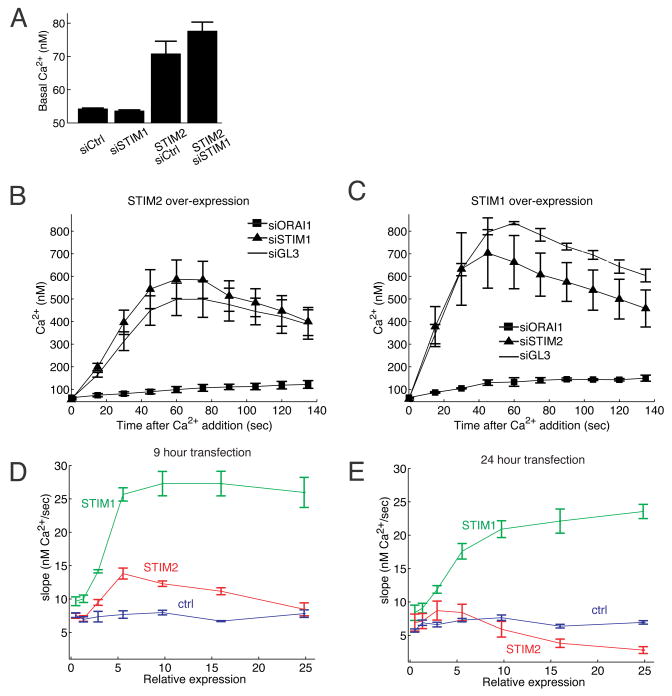
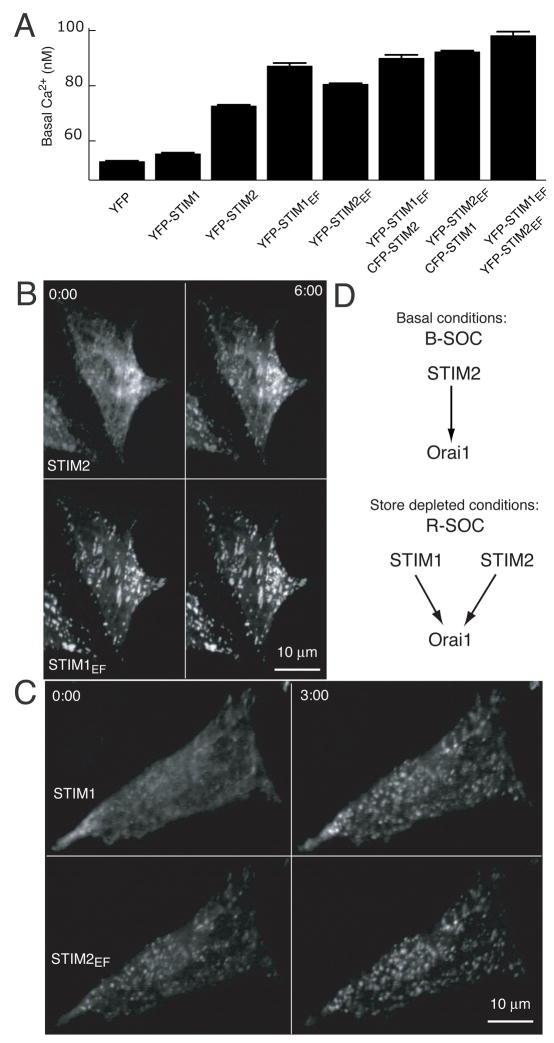
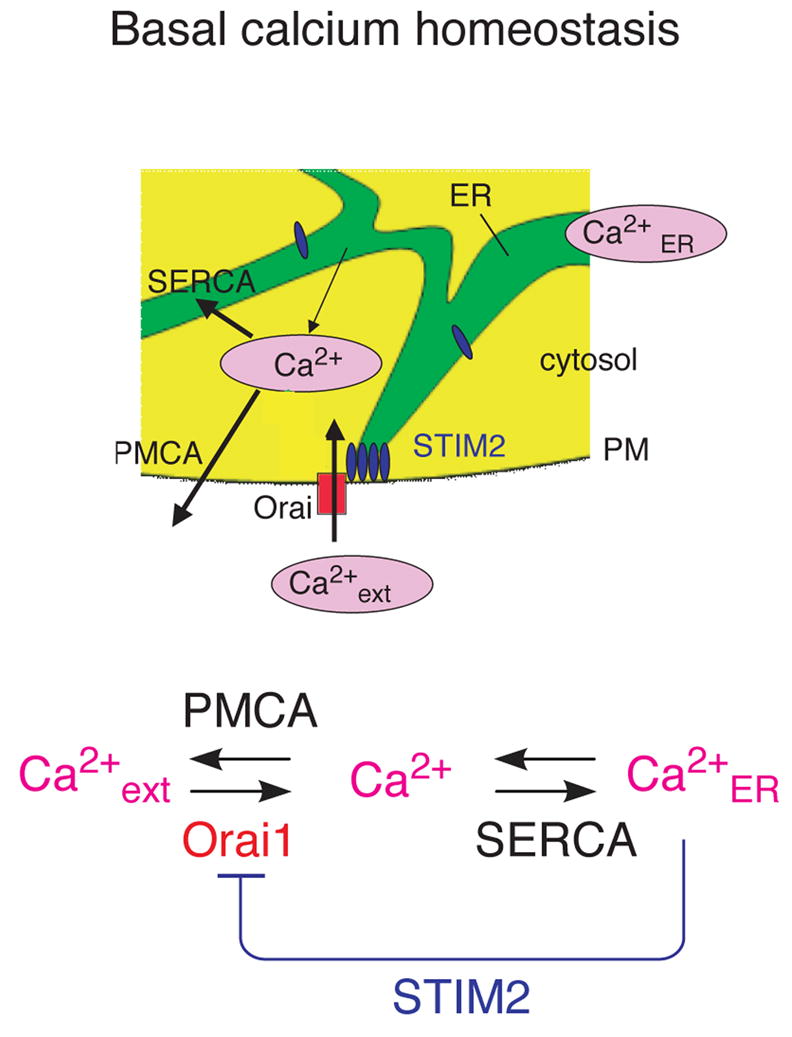
Deviations in basal Ca2+ levels interfere with receptor-mediated Ca2+ signaling as well as endoplasmic reticulum (ER) and mitochondrial function. While defective basal Ca2+ regulation has been linked to various diseases, the regulatory mechanism that controls basal Ca2+ is poorly understood. Here we performed an siRNA screen of the human signaling proteome to identify regulators of basal Ca2+ concentration and found STIM2 as the strongest positive regulator. In contrast to STIM1, a recently discovered signal transducer that triggers Ca2+ influx in response to receptor-mediated depletion of ER Ca2+ stores, STIM2 activated Ca2+ influx upon smaller decreases in ER Ca2+. STIM2, like STIM1, caused Ca2+ influx via activation of the plasma membrane Ca2+ channel Orai1. Our study places STIM2 at the center of a feedback module that keeps basal cytosolic and ER Ca2+ concentrations within tight limits.


Figures

Figure 1
Figure 1. Identification of STIM2 as a regulator of basal Ca2+ concentration
(A) Overview of intracellular Ca2+ homeostasis. Basal cytosolic Ca2+ concentration is controlled by PM as well as ER Ca2+ channels and pumps. (B) Sensitized siRNA screening assay for basal Ca2+ regulation. 2304 diced siRNA constructs were individually transfected into HeLa cells and cultured in 384 well plates. High and Low extracellular Ca2+ exposure (+10 mM and ~0.1 mM) were used for sensitization. Single cell Ca2+ levels were measured using automated image analysis software. (C) Test experiments using a siRNA set targeting Ca2+ pumps, channels, and exchangers (performed in duplicate). Deviations from control Ca2+ levels are shown in units of standard deviation. (D) Result from the sensitized siRNA screen of the human signaling proteome highlighting STIM2 and Calm1 as primary hits (performed in triplicate). (E) Schematic representation of modular domains found in STIM2. On the luminal side: EF-hand is a Ca2+ binding domain and SAM is a conserved protein interaction domain. On the cytosolic side: CC and PB are a coiled-coil and a polybasic region, respectively.
Figure 2
Figure 2. STIM2 controls basal cytosolic and ER Ca2+ concentration
(A) Comparison of basal Ca2+ levels after siRNA knockdown of STIM2 compared to STIM1. HeLa, HUVEC, and HEK293T cells were transfected with synthetic siRNA against STIM2 and STIM1 as well as diced GL3 as a control. N=10 sites; error bars represent standard error. (B) STIM1 and STIM2 siRNA specificity assayed by Western blot. HeLa cells were tranfected with siRNAs targeting STIM1, STIM2 or control for 3 days. (C) STIM2 knockdown lowers basal ER Ca2+. ER Ca2+ levels were measured in two ways. First, as the Ca2+ pool released by addition of the Ca2+-ionophore ionomycin. 1 μM ionomycin + 3 mM EGTA were added to HeLa cells and the increase in cytosolic Ca2+ was measured (Δpeak). Single cell analysis from 3 wells each. In a second method, the ER targeted cameleon D1ER was transfected into cells two days after siRNA transfection and one day before imaging. FRET/CFP was then computed as described in Materials and Methods (8 sites). (D) Schematic representation of the effects of PMCA1, SERCA2, and STIM2 knockdowns on basal Ca2+ levels in the ER and cytosol. (E) Single cell analysis of basal Ca2+ concentration as a function of the expression level of YFP-STIM2 versus YFP-STIM1. Cells were transfected for 9 hours with YFP-STIM1, YFP-STIM2, or YFP (as a control). Ca2+ levels and YFP construct expression were measured for each cell. YFP fluorescence was normalized to the background in the YFP channel. (F) Single cell analysis of Ca2+-influx triggered by ER Ca2+ store-depletion (Ca2+-add back experiments). Cells were depleted of ER Ca2+ by additions of 1 μM thapsigargin to block SERCA pumps and 3 mM external EGTA to prevent Ca2+ influx. Ca2+ was added back (to a free concentration of 0.75 mM) at t=0 to measure Ca2+ influx rates. Single cells were analyzed in 3 independent wells for each condition.
Figure 3
Figure 3. STIM2 translocates to ER-PM junctions following ER Ca2+ depletion and regulates Orai1
(A–C) YFP-STIM2 was expressed (~24 hour) in HeLa (A), HUVEC, (B), and HEK293T (C) cells and confocal images were taken before and 2 minutes after 1 μM thapsigargin addition. (D) Comparison of the distribution of CFP-STIM1 and YFP-STIM2 constructs 2 min after addition of thapsigargin. (E) Ca2+-binding deficient YFP-STIM2 (point mutation in EF-hand) is prelocalized to ER-PM junction sites and does not alter its localization after Ca2+ store depletion. (F) Knockdown of the PM Ca2+ channel Orai1 significantly reduces the increase in basal Ca2+ resulting from STIM2 expression. HeLa cells were transfected for two days with GL3, Orai1, Orai1, or Orai3 siRNA and then transfected for 24 hours with YFP-STIM2 or YFP as control. Cells used in the analysis expressed YFP at 7.5 to 15 fold above background. N=10 sites.
Figure 4
Figure 4. STIM2 translocation is cooperatively triggered by small decreases in ER Ca2+ concentration compared to larger decreases needed for STIM1
(A) STIM2 translocates to ER-PM junctions for small decreases in ER Ca2+ concentrations compared to STIM1. YFP-STIM2 and CFP-STIM1 were co-tranfected (~24 hour) and imaged in the same cells. ER Ca2+ stores were depleted slowly by extracellular addition of 3 mM EGTA. YFP-STIM2 and CFP-STIM1 distributions are compared before, 4 minutes after and 35 minutes after 3 mM EGTA addition. (B) Analysis of the kinetics of STIM1 and STIM2 translocation to ER-PM junctions upon EGTA addition. 3 mM EGTA was added to HeLa cells and imaged for 60 minutes. Cells were analyzed for puncta content as described in the Materials and Methods section. Average puncta intensity from N=5 cells. (C) Calibration and quantitative model derived from the data in (B). ER Ca2+ concentration was calibrated as a function of time after EGTA addition (Figure S5A). The concentration dependence of translocation was then fit to a cooperative oligomerization and translocation model (thick dashed lines). The scheme shows the key features of our model that includes, in addition to the differential Ca2+ sensitivity, an oligomerization and translocation process with a cooperativity of 5 for STIM2 and 8 for STIM1 activation. (D) ER Ca2+ overload reduces STIM2 puncta to sub-basal levels. 1 μM BHQ + 3 mM EGTA was added to YFP-STIM2 expressing cells and then washed out with extracellular buffer containing 10 mM Ca2+, causing a large Ca2+ influx and super-normal ER Ca2+ levels. (E-F) Functional comparison supporting that STIM2 activity is suppressed at higher ER-Ca2+ levels compared to STIM1. Basal Ca2+ levels were measured as a function of the expression level of STIM1 and STIM2 constructs (9 h of transfection). Normal (dashed lines) and reduced (solid lines) ER Ca2+ levels were used to probe for the STIM1 and STIM2 Ca2+ sensitivities. Expression of EF-hand mutant STIM2 and STIM1 constructs (black) were employed as a reference of Ca2+-insensitive and constitutively active proteins and were used to normalize the wildtype data (each isoform of STIM was divided by the maximum basal level for the corresponding EF hand mutant in the same condition). In normal ER conditions, wildtype STIM1 (green) or STIM2 (red) expression showed a marked difference in basal Ca2+ profile compared the EF-hand mutants. In contrast, STIM2 but not STIM1 closely matched the profile of its EF-hand mutant at reduced ER Ca2+ levels, suggesting that reduced ER Ca2+ levels can still suppress STIM1 but not STIM2 activity. N=25 sites.
Figure 5
Figure 5. STIM2 can regulate Ca2+ influx independent of STIM1
(A) STIM2 expression-mediated increases in basal Ca2+ are not affected by knockdown of STIM1. Cells were transfected with YFP-STIM2 ~60 hours after STIM1 or GL3 control siRNA transfection and 9 hours before imaging. Cells selected expressing YFP at background autofluorescence (non transfected) or 4–8 times autofluorescense (transfected). N=15 sites. (B-C) Experiments showing that STIM2-triggered R-SOC is not affected by STIM1 knockdown and STIM1-triggered R-SOC is not significantly affected by STIM2 knockdown. Ca2+ addback experiments were performed in cells prepared and selected as described in (A) expressing STIM2 (B) and STIM1 (C). 9 hour transfection. N=3 wells. (D-E) Control experiment showing that prolonged overexpression of YFP-STIM2 downregulates the maximal attainable Ca2+ influx rate. Influx rates were measured in Ca2+ add-back experiments in the presence of thapsigargin. Expression at 9 hours (D) is compared to expression at 24 hours (E). N=4 sites from 2 wells.
Figure 6
Figure 6. STIM2 and STIM1 act synergistically and independently of each other
(A) Test for synergism and independence between STIM1 and STIM2. YFP tagged constructs were cotransfected with YFP or CFP constructs as indicated for 24 hours. Ca2+-levels are shown for cells expressing YFP signals 1–3 fold above autofluorescence. (B) STIM2 can translocate in the presence of prelocalized STIM1EF. CFP-STIM2 and YFP-STIM1EF were cotransfected and imaged before and 6 minutes after addition of 1 μM thapsigargin. (C) STIM1 can translocate in the presence of of prelocalized STIM2EF. CFP-STIM1 and YFP-STIM2EF were cotransfected and imaged before and 3 minutes after addition of 1 μM thapsigargin. (D) Schematic representation of identified regulators of Ca2+-influx for basal versus receptor-triggered stimulation condition.
Figure 7
Figure 7. Model for STIM2 function in basal Ca2+ homoestasis
Schematic representations of the stabilization of basal cytosolic and ER Ca2+ concentrations by negative feedback.

References

    1. Berridge MJ, Bootman MD, Roderick HL. Ca2+ signalling: dynamics, homeostasis and remodelling. Nat Rev Mol Cell Biol. 2003;4:517–29. - PubMed
    1. Bezprozvanny I, Hayden MR. Deranged neuronal Ca2+ signaling and Huntington disease. Biochem Biophys Res Commun. 2004;322:1310–7. - PubMed
    1. Brini M, Pinton P, Pozzan T, Rizzuto R. Targeted recombinant aequorins: tools for monitoring [Ca2+] in the various compartments of a living cell. Microsc Res Tech. 1999;46:380–9. - PubMed
    1. Camello C, Lomax R, Petersen OH, Tepikin AV. Calcium leak from intracellular stores--the enigma of calcium signalling. Cell Calcium. 2002;32:355–61. - PubMed
    1. Campanella M, Pinton P, Rizzuto R. Mitochondrial Ca2+ homeostasis in health and disease. Biol Res. 2004;37:653–60. - PubMed

Publication types

MeSH terms