. 2008 Apr 25;283(17):11633-44.
doi: 10.1074/jbc.M708995200. Epub 2007 Dec 26.

Apolipoprotein AII is a regulator of very low density lipoprotein metabolism and insulin resistance

Affiliations

Apolipoprotein AII is a regulator of very low density lipoprotein metabolism and insulin resistance

Lawrence W Castellani et al. J Biol Chem. .

Abstract

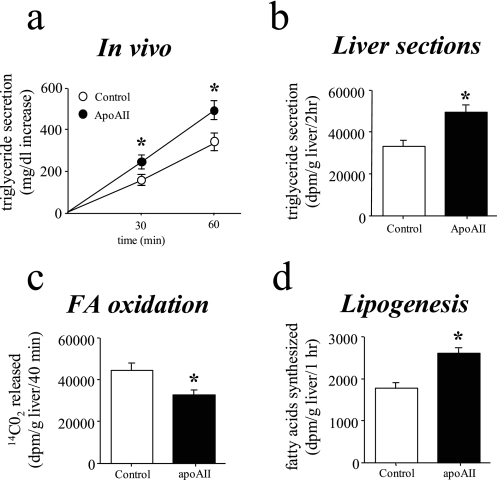
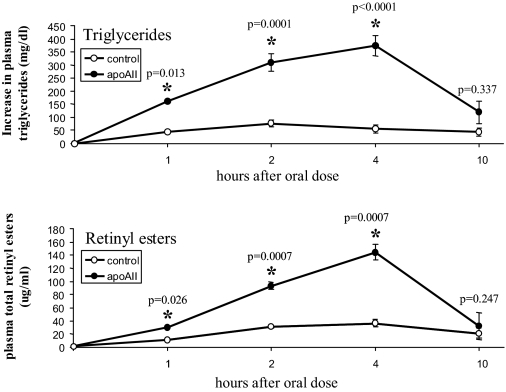
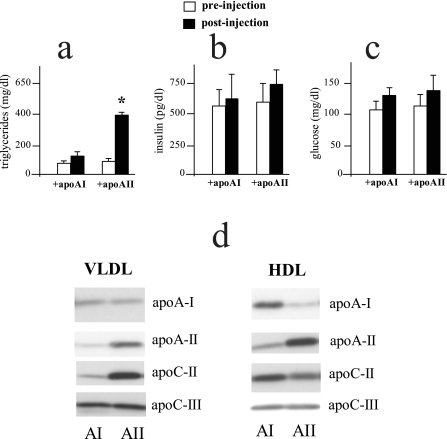
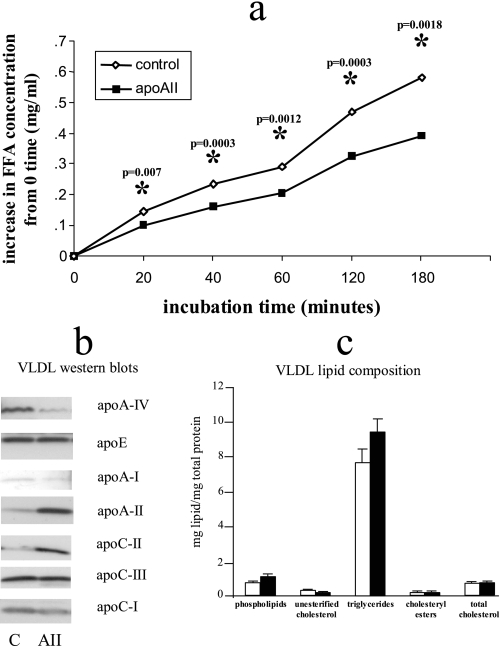
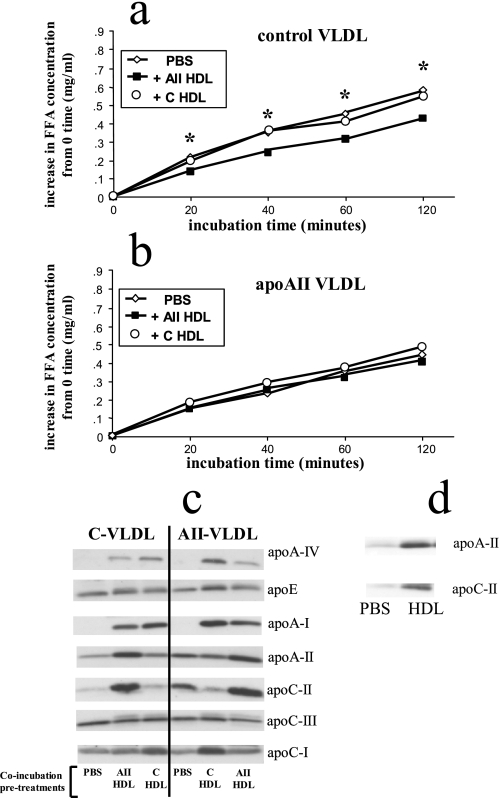
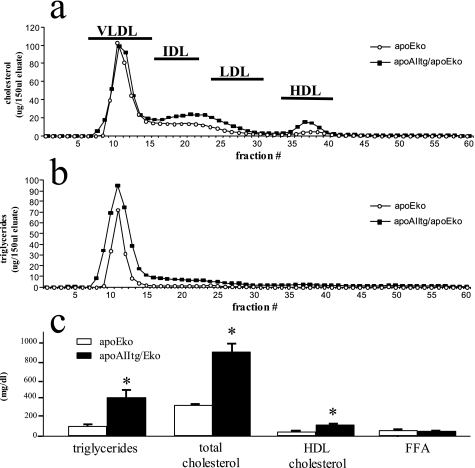
Apolipoprotein AII (apoAII) transgenic (apoAIItg) mice exhibit several traits associated with the insulin resistance (IR) syndrome, including IR, obesity, and a marked hypertriglyceridemia. Because treatment of the apoAIItg mice with rosiglitazone ameliorated the IR and hypertriglyceridemia, we hypothesized that the hypertriglyceridemia was due largely to overproduction of very low density lipoprotein (VLDL) by the liver, a normal response to chronically elevated insulin and glucose. We now report in vivo and in vitro studies that indicate that hepatic fatty acid oxidation was reduced and lipogenesis increased, resulting in a 25% increase in triglyceride secretion in the apoAIItg mice. In addition, we observed that hydrolysis of triglycerides from both chylomicrons and VLDL was significantly reduced in the apoAIItg mice, further contributing to the hypertriglyceridemia. This is a direct, acute effect, because when mouse apoAII was injected into mice, plasma triglyceride concentrations were significantly increased within 4 h. VLDL from both control and apoAIItg mice contained significant amounts of apoAII, with approximately 4 times more apoAII on apoAIItg VLDL. ApoAII was shown to transfer spontaneously from high density lipoprotein (HDL) to VLDL in vitro, resulting in VLDL that was a poorer substrate for hydrolysis by lipoprotein lipase. These results indicate that one function of apoAII is to regulate the metabolism of triglyceride-rich lipoproteins, with HDL serving as a plasma reservoir of apoAII that is transferred to the triglyceride-rich lipoproteins in much the same way as VLDL and chylomicrons acquire most of their apoCs from HDL.


Figures

FIGURE 1.
FIGURE 1.
Rates of triglyceride secretion, hepatic fatty acid oxidation, and lipogenesis. a, rates of in vivo triglyceride secretion were determined in apoAIItg and control mice that had been fasted overnight. Triton WR-1339 (100 mg/kg body wt) was administered via the tail vein. The plasma triglyceride concentrations were determined at the initial “0 time” bleed and at 30 min and 1 h post injection. Triglyceride secretion was calculated as the increase in total plasma triglyceride concentration over the 0 time values, which were 56 ± 4 and 287 ± 32 mg/dl for control and apoAIItg mice, respectively. Data represent the mean ± S.E. for eight animals in each group. *, values significantly different (p < 0.05) than control mice. b, rates of triglyceride secretion were determined in liversections obtained from apoAIItg and control mice that had been fasted overnight. The liver sections were weighed and immediately incubated for 2 h in Krebs-Henseleit buffer that contained a bovine serum albumin/[U-14C]palmitic acid (2.5 μCi/ml) complex. Total lipids were extracted from the media and separated into various lipid fractions by TLC. The radioactivity in the triglyceride fraction was determined by liquid scintillation spectrometry. Data represent the mean ± S.E. for eight animals in each group. *, values significantly different (p < 0.05) than control mice. c, oxidation of 14C-labeled palmitate to 14CO2 was determined in liver sections obtained from control and apoAIItg mice that had been fasted overnight. Data represent the mean ± S.E. for six animals in each group. *, values that are significantly different (p < 0.05) than control mice. d, rates of lipogenesis were determined in liver sections obtained from mice that had been fasted overnight. They were incubated for 1 h in Krebs-Henseleit bicarbonate buffer containing 3H2O (0.5 mCi/vessel) as the radioactive tracer to label newly synthesized fatty acids. Total lipid extract of tissue and media were then hydrolyzed, and the lipids were re-extracted and dried under nitrogen. The sample was then separated by TLC, and radioactivity in the fatty acids was determined by liquid scintillation spectrometry. Data represent the mean ± S.E. for six animals in each group. *, values that are significantly different (p < 0.05) than control mice.
FIGURE 2.
FIGURE 2.
Chylomicron clearance. Mice were fasted for 4 h, beginning at 5:00 a.m. Beginning at 9:00 a.m. retinyl palmitate/corn oil was administered by oral gavage (150 μl per animal). A zero time bleed was obtained from the retro-orbital plexus just prior to administration of the retinyl palmitate, and subsequent bleeds followed at 1, 2, 4, and 10 h post gavage. Triglyceride (upper panel) and total retinyl ester (lower panel) plasma concentrations were then determined at each time point. Data represent the mean ± S.E. for eight animals in each group for the changes in triglycerides and retinyl esters from the 0 time values. *, values that are significantly different than control mice.
FIGURE 3.
FIGURE 3.
Acute effects of in vivo apoAII injection on plasma triglycerides, insulin, glucose, and apolipoprotein composition. Mouse apoAII and apoAI (used as a control) were isolated as described under “Experimental Procedures.” Following an overnight fast, 4 mg of either the apoAI or apoAII (columns indicated as +apoAI and +apoAII, respectively) were administered to C57BL/6J control mice via tail vein injection. Mice were bled from the retro-orbital plexus under isoflorane anesthesia just prior to injection (pre-injection) and at 4 h post-injection. Plasma triglyceride (a), insulin (b), and glucose (c) concentrations were determined as described under “Experimental Procedures.” Data represent the mean ± S.E. for 14 animals in each group for triglycerides and 6 animals in each group for insulin and glucose. *, values that are significantly different (p < 0.05) than control (+apoAI) mice. d, the plasma samples from six animals in each group, apoAI (AI) injected and apoAII (AII) injected, were pooled and the VLDL and HDL lipoprotein fractions isolated by ultracentrifugation as described under “Experimental Procedures.” Equal amounts of total VLDL and HDL protein were subjected to PAGE electrophoresis, and relative amounts of apoAII, apoAI, apoCII, and apoCIII were determined by Western blot analysis as described under “Experimental Procedures.” Differences in band intensity between the AI and AII groups for the same apolipoprotein reflect differences in protein mass. Differences in intensity between different apolipoproteins may not reflect actual differences in mass.
FIGURE 4.
FIGURE 4.
VLDL apolipoprotein and lipid composition and in vitro hydrolysis rates of VLDL triglycerides. VLDL (d < 1.0063) were isolated from plasma of overnight fasted control and apoAIItg mice by ultracentrifugation. a, VLDL at a final triglyceride concentration of 90 mg/dl were then incubated with isolated LPL (Sigma bovine milk LPL) at a final concentration of 24 μg/ml. Four replicates for each time point were incubated at 37 °C for 20, 40, 60, 120, and 180 min. At the end of each incubation period, the hydrolysis was stopped by adding 8 m urea to the reaction. Data represent the mean ± S.E. for the increase in free fatty acids above the 0 time values. *, values that are significantly different (p < 0.05) than control mice (S.E. bars are too small to be seen). b, isolated VLDLs were subjected to PAGE electrophoresis followed by Western blot analysis to determine the content of apolipoproteins, apoAII, apoAI, apoAIV, apoCI, apoCII, apoCIII, and apoE from control (C) and apoAIItg (AII) VLDL. Sample loading was normalized by total protein mass. Two sets of molecular weight markers were run on each gel as described under “Experimental Procedures” but are not included in the figure. These analyses were repeated three times on different batches of VLDL with very similar results each time. Data from a representative analysis are presented. Differences in intensity of each individual apolipoprotein reflect differences in protein content between C and AII groups. Differences in intensities between different apolipoproteins may not accurately reflect differences in their protein masses. c, analysis of phospholipids, unesterified cholesterol, triglycerides, cholesteryl esters, and total cholesterol was then determined on the isolated VLDLs as described under “Experimental Procedures.” Lipid data have been normalized by total VLDL protein, and values are presented as the mean ± S.E. from three separate VLDL preparations for each group.
FIGURE 5.
FIGURE 5.
In vitro hydrolysis of VLDL triglycerides and changes in apolipoprotein composition after preincubation with HDL. VLDL (d < 1.0063) and HDL (d = 1.063-1.21) were isolated by density gradient ultracentrifugation from plasma of control and apoAIItg mice that had been fasted overnight. Aliquots of VLDL from both control mice (a) and apoAIItg mice (b) were incubated with PBS alone (PBS), HDL from the apoAIItg mice (+AII HDL), or HDL from control mice (+C HDL) at 37 °C for 1 h. The HDL and VLDL were then re-isolated by gel filtration chromatography using an Amersham Biosciences fast-protein liquid chromatography system. Aliquots of the VLDL re-isolated after the in vitro incubation with HDL were then tested in the in vitro hydrolysis assay as described in the legend of Fig. 4. Data represent the mean ± S.E. for the increase in free fatty acids above the 0 time values. There are four replicates at each time point for each group. *, values that are significantly different (p < 0.05) compared with VLDL incubated with PBS alone (S.E. bars are too small to be seen). c, apolipoproteins from the control VLDL (C-VLDL) and apoAIItg VLDL (AII-VLDL) from the various incubations were then separated by PAGE. Western blot analysis was performed as described under “Experimental Procedures” to determine changes in apolipoproteins apoAI, apoAII, apoAIV, apoCI, apoCII, apoCIII, and apoE after the incubations. Differences in band intensity among any of the lanes for each individual apolipoprotein represent actual differences in mass. Differences in band intensity between different apolipoproteins do not necessarily represent actual differences in mass. d, aliquots of the control VLDL inside 50-kDa molecular mass cutoff dialysis tubing were dialyzed against apoAIItg HDL (HDL) or PBS alone (PBS) for 12 h at room temperature as described under “Experimental Procedures.” The VLDL was then recovered and the mass of apoAII and CII determined by PAGE electrophoresis and Western blotting. A separate control was performed with only PBS in the dialysis tubing incubated against the apoAII HDL. No apoCII or apoAII could be detected in the PBS after 12-h incubation (data not shown).
FIGURE 6.
FIGURE 6.
Plasma lipid profile of apoEko and combined apoAIItg/apoEko mice. Plasma was pooled from 12 apoEko and apoAIItg/apoEko mice that had been maintained on a standard chow diet and fasted overnight. The lipoprotein fractions were separated by gel filtration using an Amersham Biosciences fast-protein liquid chromatography system as described under “Experimental Procedures.” Cholesterol (a) and triglyceride (b) concentrations were determined in each fraction. Plasma lipid concentrations (c) were also determined as described under “Experimental Procedures.” Data represent the mean ± S.E. for 12 animals in each group. *, values significantly different (p < 0.05) than apoEko mice.
FIGURE 7.
FIGURE 7.
Plasma concentrations of MCP-1 and TNF-α. MCP-1 (a) and TNF-α (b) plasma concentrations were determined by enzyme-linked immunosorbent assay on plasma from C57BL/6J control or apoAIItg mice that had been maintained on a standard chow diet and fasted overnight. Data represent the mean ± S.E. for 15 animals in each group. *, values that are significantly different (p < 0.05) than control mice.

References

    1. Schonfeld, G., Bailey, A., and Steelman, R. (1978) Lipids 12 951-959 - PubMed
    1. Tall, A. R. (1998) Eur. Heart J. 19 Suppl. A, A31-A35 - PubMed
    1. Castellani, L. W., Navab, M., Van Lenten, B. J., Hedrick, C. C., Hama, S. Y., Goto, A. M., Fogelman, A. M., and Lusis, A. J. (1997) J. Clin. Invest. 100 464-474 - PMC - PubMed
    1. Barbaras, R., Puchois, P., Fruchart, J. C., and Ailhaud, G. (1987) Biochem. Biophys. Res. Commun. 142 63-69 - PubMed
    1. Warden, C. H., Hedrick, C. C., Qiao, J. H., Castellani, L. W., and Lusis, A. J. (1993) Science 261 469-472 - PubMed

Publication types

LinkOut - more resources