. 2008 Jan 8;105(1):94-9.
doi: 10.1073/pnas.0708579105. Epub 2007 Dec 26.

Evolutionarily conserved gene family important for fat storage

Affiliations

Evolutionarily conserved gene family important for fat storage

Bert Kadereit et al. Proc Natl Acad Sci U S A. .

Abstract

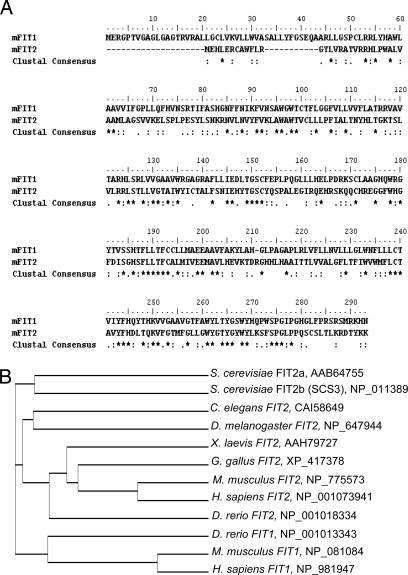
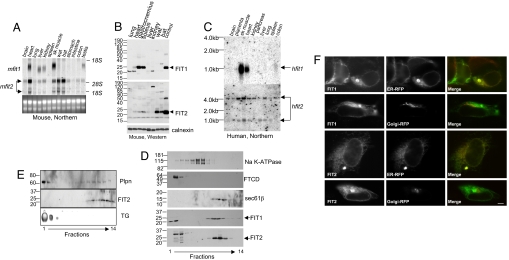
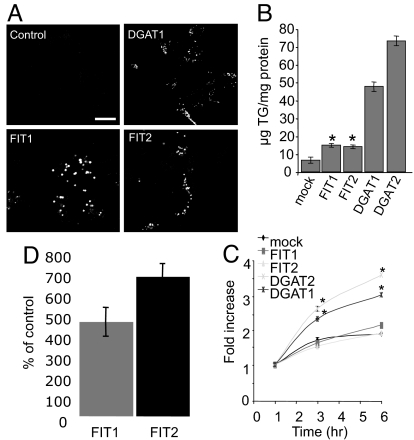
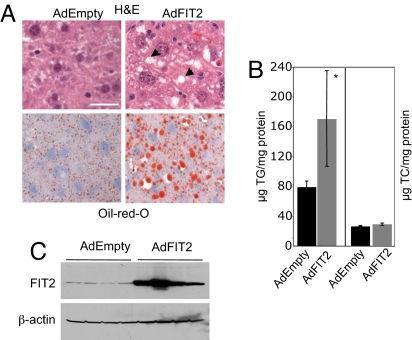
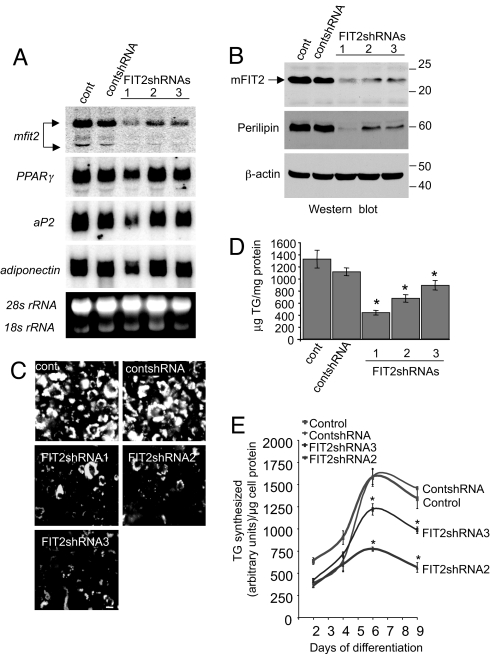
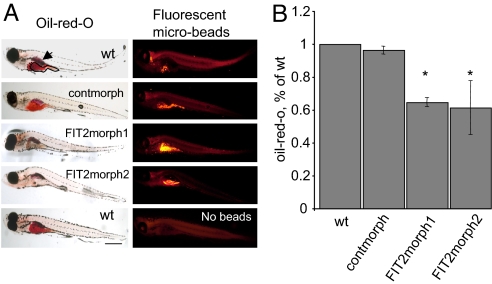
The ability to store fat in the form of cytoplasmic triglyceride droplets is conserved from Saccharomyces cerevisiae to humans. Although much is known regarding the composition and catabolism of lipid droplets, the molecular components necessary for the biogenesis of lipid droplets have remained obscure. Here we report the characterization of a conserved gene family important for lipid droplet formation named fat-inducing transcript (FIT). FIT1 and FIT2 are endoplasmic reticulum resident membrane proteins that induce lipid droplet accumulation in cell culture and when expressed in mouse liver. shRNA silencing of FIT2 in 3T3-LI adipocytes prevents accumulation of lipid droplets, and depletion of FIT2 in zebrafish blocks diet-induced accumulation of lipid droplets in the intestine and liver, highlighting an important role for FIT2 in lipid droplet formation in vivo. Together these studies identify and characterize a conserved gene family that is important in the fundamental process of storing fat.


Conflict of interest statement

The authors declare no conflict of interest.

Figures

Fig. 1.
Fig. 1.
FIT sequence analysis. (A) Amino acid sequence alignment of murine FIT1 and FIT2 (35% identical, 50% similar). (B) Sequence alignments of FIT orthologs in multiple species. Cladogram generated with ClustalW showing the amino acid sequence homologies among FIT proteins. Accession numbers for each FIT ortholog are indicated next to the cladogram.
Fig. 2.
Fig. 2.
Analysis of FIT expression and localization. (A) Fifteen micrograms of total RNA from the mouse tissues shown was subjected to Northern blot analysis for murine FIT1 and FIT2 (mfit1 and mfit2). Sk muscle, skeletal muscle; wat, white adipose tissue; bat, brown adipose tissue. The ethidium bromide-stained gel indicates loading. (B) Eighty micrograms of total cell lysates from the selected mouse tissues shown was subjected to Western blot analysis. Calnexin served as a loading control. Other cross-reacting bands not indicated by arrows are nonspecific. Lysates from HEK293 cells expressing FIT1 or FIT2 served as positive controls. (C) A human RNA blot was analyzed for both fit1 and fit2 (hfit1 and hfit2) expression. (D) Total postnuclear membranes from mouse hearts were separated by continuous sucrose gradients (fractions shown from lowest to highest density). Fractions were subjected to Western blot analysis by using antibody markers for the plasma membrane (Na K-ATPase), Golgi apparatus (FTCD/Gogli 58-kDa protein), ER (Sec61-β), and FIT1 and FIT2. (E) Lipid droplets and membranes from mouse brown adipose tissue were fractionated on a continuous sucrose gradient, and fractions were subjected to Western blot analysis for FIT2 and perilipin (Plpn) and determination of TG in each fraction by TLC analysis. (F) Mouse FIT1-V5 and FIT2-V5 colocalized with the ER marker protein RFP-KDEL (ER-RFP) but not with the Golgi-specific marker GalTase-RFP (Golgi-RFP) in HEK293 cells. (Scale bar: 10 μm.)
Fig. 3.
Fig. 3.
Lipid droplet formation induced by FIT1 and FIT2. (A) HEK293 cells were transiently transfected with mouse FIT1, FIT2, or DGAT1, and lipid droplets were visualized by using confocal fluorescence microscopy by staining with BODIPY 493/503. (Scale bar: 5 μm.) (B) TG mass measurements from transiently transfected HEK293 cells with the indicated constructs. Data are represented as the mean ± SD. *, Mock versus FIT1 or FIT2 (P < 0.001) (n = 4 transfections per construct; four independent experiments). (C) TG biosynthesis was determined in transfected HEK293 cells for the indicated times. DGATs served as positive controls for TG biosynthesis. Data are represented as the mean ± SD. *, Mock versus DGAT1 or DGAT2 (P < 0.0001) (n = 4 transfections per construct; three independent experiments). (D) Newly synthesized TG in the buoyant lipid droplet fractions from FIT1- and FIT2-expressing HEK293 cells was significantly enriched compared with mock-transfected cells. Data are represented as the mean ± SD of the percentage of mock-transfected (control) cells. Control versus FIT1 or FIT2 (P = 0.0001) (n = 4 per transfection; two independent experiments).
Fig. 4.
Fig. 4.
Expression of FIT2 in mouse liver. (A) Mice were injected with control adenovirus (Adempty) or adenovirus-expressing FIT2 (AdFIT2). AdFIT2 mice after 7 days had increased hepatic lipid droplets as judged by both H&E staining showing cleared spaces that indicated the presence of lipid droplets within hepatocytes (examples indicated with arrows) and Oil red O staining, indicating that these cleared spaces are TG-rich lipid droplets. These images are representative of observations made on six mice per group. (Scale bar: 12 μm.) (B) TG, but not cholesterol, was significantly increased in livers of mice expressing FIT2 (n = 6). Data represented as mean ± SD. *, AdEmpty versus AdFIT2 (P < 0.001). The large range in TG values correlated with the range in FIT2 expression shown in C. (C) Western blot analysis of FIT2 expression in livers of mice, indicating increased expression in AdFIT2-injected mice. β-actin served as a loading control.
Fig. 5.
Fig. 5.
shRNA-mediated knockdown of FIT2 in adipocytes. 3T3-L1 cells were not infected or were infected with lentivirus-expressing shRNA sequences targeting murine FIT2 (FIT2shRNA1,2,3) or control shRNA (contshRNA) and differentiated for 7 days. (A) Northern blot analysis shows that FIT2shRNAs significantly reduced FIT2 mRNA levels compared with noninfected control (cont) and contshRNA-infected cells. Expression of adipocyte differentiation markers PPARγ, aP2, and adiponectin/ACRP30 are shown. The ethidium bromide-stained RNA gel serves to indicate loading. (B) Western blot analysis shows that FIT2 and Perilipin were reduced in FIT2shRNA cells, compared with controls. (C) FIT2shRNAs reduced lipid droplet accumulation in differentiated 3T3-L1 cells as visualized by BODIPY493/503 staining of lipid droplets. (Scale bar: 10 μm.) (D) Quantification of cellular TG in differentiated 3T3-L1 cells shows reduced TG levels in the FIT2 knockdown cells. Data represented as mean ± SD. *, FIT2shRNA1–3 versus controls P < 0.0001. (E) TG synthesis measurements were performed at the indicated time points during differentiation. Each time point represents three independent samples for each time point and is shown as mean ± SD. *, FIT2shRNA2,3 versus controls (P < 0.001). A–D are representative of three independent experiments. E is representative of two independent experiments.
Fig. 6.
Fig. 6.
Morpholino-mediated knockdown of FIT2 in zebrafish. (A) FIT2 morphants showed decreased staining for Oil red O in liver (outlined by dashed line in wild type) and intestine (outlined by solid line in wild type), compared with control fish (no morpholino control, WT; and nonspecific control morpholino, contmorph). Swim bladders of zebrafish stain with Oil red O (indicated by arrow). FIT2 morphants did not exhibit defects in feeding as judged by ingestion of nonabsorbable fluorescent microbeads. A WT control fed a high-fat diet without microbeads is shown (no beads) to demonstrate that fluorescence is because of ingested microbeads, not autofluorescence of fish. These images are representative of n = 400 fish, three independent experiments. (Scale bar: 0.4 mm.) (B) Quantification of Oil red O staining by spectrophotometric analysis in WT, contmorph, FIT2morph1, and FIT2morph2 fish (n = 20 fish per group, averaged over four independent experiments). *, WT versus morphants (P < 0.001) and shown as mean ± SD.

References

    1. Martin S, Parton RG. Nat Rev Mol Cell Biol. 2006;7:373–378. - PubMed
    1. Spiegelman BM, Flier JS. Cell. 2001;104:531–543. - PubMed
    1. Brasaemle DL, Dolios G, Shapiro L, Wang R. J Biol Chem. 2004;279:46835–46842. - PubMed
    1. Liu P, Ying Y, Zhao Y, Mundy DI, Zhu M, Anderson RG. J Biol Chem. 2004;279:3787–3792. - PubMed
    1. Beller M, Riedel D, Jansch L, Dieterich G, Wehland J, Jackle H, Kuhnlein RP. Mol Cell Proteomics. 2006;5:1082–1094. - PubMed

Publication types

MeSH terms

Associated data