. 2008 Jan 8;105(1):323-8.
doi: 10.1073/pnas.0706211105. Epub 2007 Dec 27.

Activity-dependent phosphorylation of Ser187 is required for SNAP-25-negative modulation of neuronal voltage-gated calcium channels

Affiliations

Activity-dependent phosphorylation of Ser187 is required for SNAP-25-negative modulation of neuronal voltage-gated calcium channels

Davide Pozzi et al. Proc Natl Acad Sci U S A. .

Abstract

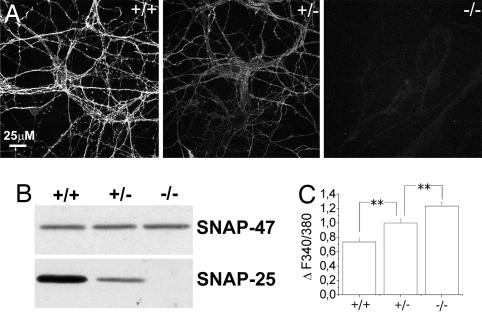
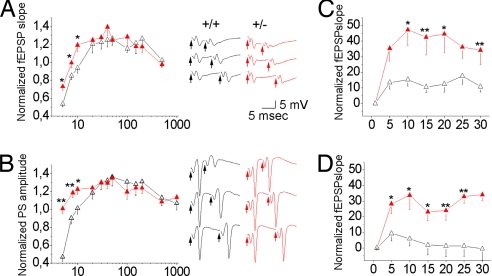
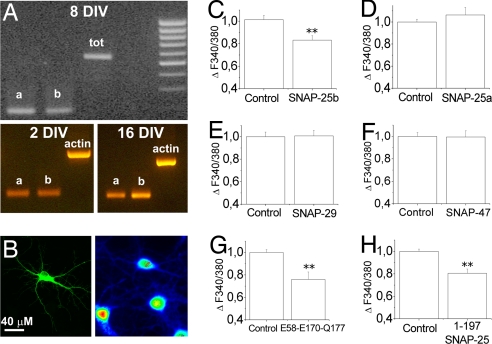
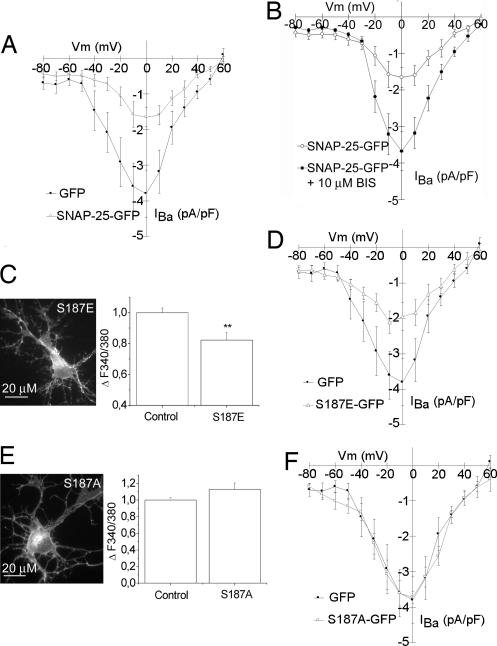
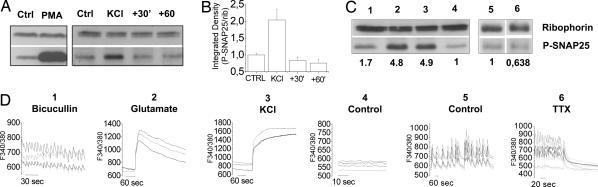
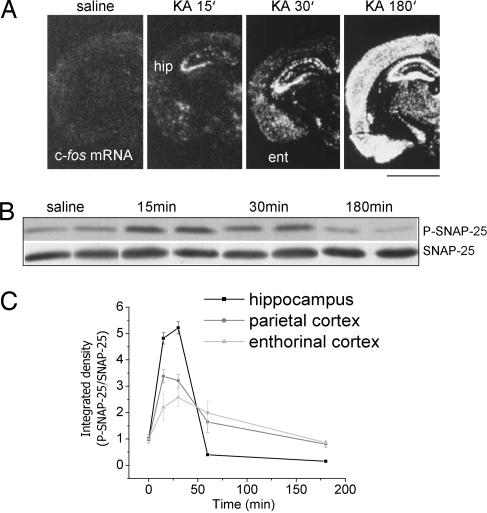
Synaptosomal-associated protein of 25 kDa (SNAP-25) is a SNARE protein that regulates neurotransmission by the formation of a complex with syntaxin 1 and synaptobrevin/VAMP2. SNAP-25 also reduces neuronal calcium responses to stimuli, but neither the functional relevance nor the molecular mechanisms of this modulation have been clarified. In this study, we demonstrate that hippocampal slices from Snap25(+/-) mice display a significantly larger facilitation and that higher calcium peaks are reached after depolarization by Snap25(-/-) and Snap25(+/-) cultured neurons compared with wild type. We also show that SNAP-25b modulates calcium dynamics by inhibiting voltage-gated calcium channels (VGCCs) and that PKC phosphorylation of SNAP-25 at ser187 is essential for this process, as indicated by the use of phosphomimetic (S187E) or nonphosphorylated (S187A) mutants. Neuronal activity is the trigger that induces the transient phosphorylation of SNAP-25 at ser187. Indeed, enhancement of network activity increases the levels of phosphorylated SNAP-25, whereas network inhibition reduces the extent of protein phosphorylation. A transient peak of SNAP-25 phosphorylation also is detectable in rat hippocampus in vivo after i.p. injection with kainate to induce seizures. These findings demonstrate that differences in the expression levels of SNAP-25 impact on calcium dynamics and neuronal plasticity, and that SNAP-25 phosphorylation, by promoting inhibition of VGCCs, may mediate a negative feedback modulation of neuronal activity during intense activation.


Conflict of interest statement

The authors declare no conflict of interest.

Figures

Fig. 1.
Fig. 1.
Calcium responses recorded from hippocampal neurons established from SNAP-25 null and heterozygous mice. (A) Analysis of SNAP-25 immunoreactivity in hippocampal cultures established from WT (+/+), heterozygous (+/−), and KO (−/−) mice. (B) Western blot analysis of SNAP-25 expression in homogenates from (+/+), (+/−), and (−/−) mouse hippocampi. SNAP-47 was used as a loading control. (C) Quantitative analysis of peak calcium responses measured upon 30 mM KCl depolarization in 9–10 DIV hippocampal neurons from WT (+/+) (0.73 ± 0.05) (n = 46), heterozygous (+/−) (1 ± 0.05) (n = 58), and KO (−/−) (1.23 ± 0.05) (n = 71) mice. Values are normalized on calcium responses measured on (+/−) cultures. *, P < 0.05; **, P < 0.01.
Fig. 2.
Fig. 2.
Short-term plasticity in WT and Snap25+/− hippocampal slices. (A and B) PPF profiles of fEPSP (A) and PS (B) recorded from the CA1 region of hippocampal slices. Note facilitation at short PPF intervals in heterozygous (n = 6) with respect to WT (n = 5) mice, which is reflected in both the fEPSP slope and PS amplitude. Representative fEPSP (upper traces) and PS (lower traces) evoked at 5, 7.5, and 10 ms IPI in WT (black lines) and heterozygous (red lines) mice are shown. Arrowheads indicate the stimulus pairs. (C and D) Frequency potentiation of fEPSP obtained by 2-Hz stimuli (delivered for 15 s) capable of evoking maximal (C) and half-maximal (D) responses. Note in both cases the significantly larger increase of the EPSP slope in heterozygous with respect to WT mice (each data point represents the mean of five responses normalized to the response to the first stimulus; data are from six slices from each mouse strain). All values are presented as mean ± SEM (Mann–Whitney U test: *, P < 0.05). Red triangles, heterozygous mice; black triangles, WT mice.
Fig. 3.
Fig. 3.
Effect of different SNAP-25 isoforms and mutants on calcium responsiveness. (A) RT-PCR analysis for SNAP-25a and SNAP-25b performed on extracts from 8 DIV cultured mouse hippocampal neurons (Upper) or 2 (Lower Left) and 16 (Lower Right) DIV rat hippocampal neurons. (B–H) Cultured hippocampal neurons expressing different GFP-conjugated SNAP-25 isoforms or mutants were loaded with the calcium-sensitive dye FURA-2 and imaged by single-cell calcium imaging. (C–H) Quantitative analysis of intracellular calcium increases upon 30 mM KCl depolarization in neurons expressing SNAP-25B [Control (CTRL), 1.00 ± 0.03, n = 58; SNAP-25B-transfected, 0.81 ± 0.011, n = 16, P < 0.01] (C); SNAP-25A (CTRL, 1.00 ± 0.02, n = 62; SNAP-25A-transfected, 1.06 ± 0.06, n = 22) (D); SNAP-29 (CTRL, 1.00 ± 0.04, n = 28; SNAP-29-transfected, 1.00 ± 0.05, n = 8) (E); SNAP-47 (CTRL, 1.00 ± 0.03, n = 33; SNAP-47-transfected, 0.99 ± 0.05, n = 8) (F); the mutant E58-E170-Q177 (CTRL, 1 ± 0.02, n = 41; mutant E58-E170-Q177-transfected, 0.76 ± 0.06, n = 28; P < 0.01) (G); and the SNAP-25 fragment 1–197 (CTRL, 1 ± 0.02, n = 34; fragment 1–197-transfected, 0.8 ± 0.03, n = 18, P < 0.01) (H). An example of a SNAP-47-GFP-transfected neuron (Left) imaged at 380 nm (Right) is shown in B. *, P < 0.05; **, P < 0.01.
Fig. 4.
Fig. 4.
Effect of SNAP-25 phosphomutants on VGCC currents in hippocampal neurons. (A and B) Mean I–V relationships of peak IBa recorded in SNAP-25-GFP- (n = 8) and GFP (n = 7)-expressing neurons (A) and in SNAP-25-GFP-expressing neurons in the presence (n = 10) or absence (n = 8) of 10 μM bisindolymaleimide I (B). (C–E) Quantitative analysis of intracellular calcium increases upon KCl depolarization in neurons expressing the phosphomimetic SNAP-25 mutant, S187E (CTRL, 1.00 ± 0.03, n = 66; S187E-transfected, 0.82 ± 0.04, n = 19, P < 0.01) (C) and the nonphosphorylated SNAP-25 S187A (CTRL, 1.00 ± 0.02, n = 54; S187A-transfected, 1.12 ± 0.07, n = 18) (E). Changes in intracellular calcium are normalized to nontransfected controls that were present in the same field of the GFP-expressing neurons. **, P < 0.05. (D and F) Mean IV relationship of peak IBa recorded in GFP-transfected control neurons (n = 7) and neurons expressing S187E-GFP (D) (n = 9) or S187A-GFP (F) (n = 8) SNAP-25 phosphorylation mutants. IBa current densities (pA/pF) are shown as mean ± SE of the number of recordings shown in parentheses.
Fig. 5.
Fig. 5.
SNAP-25 phosphorylation is modulated by network activity. (A) (Left) Western blot analysis of SNAP-25 phosphorylation in hippocampal cultures (12 DIV) in control conditions or after stimulation with 1 μM PMA for 30 min. (Right) Time course of SNAP-25 phosphorylation in cultures exposed to 30 mM KCl for 5 min, immediately solubilized (KCl), or washed and solubilized after 30 or 60 min. (B) Quantitative analysis of P-SNAP immunoreactivity normalized to ribophorin. (C and D) Calcium imaging (D) was coupled to Western blot analysis (C) to correlate calcium dynamics and SNAP-25 phosphorylation. Fura-2-loaded cultures were recorded by single-cell calcium imaging upon exposure to 40 μM bicucullin for 15 min (labeled no. 1), 100 μM glutamate for 5 min (labeled no. 2), 50 mM KCl for 5 min (labeled no. 3), and in control conditions (labeled no. 4). Astrocyte-enriched oscillating cultures were monitored under control conditions (labeled no. 5) or on incubation with 1 μM TTX for 30 min (labeled no. 6). (C) Afterward, recordings cultures were quickly solubilized and analyzed by Western blotting. Numbers above the blots indicate homogenates from the single coverslips recorded in D; numbers below the blots indicate quantitation of P-SNAP immunoreactivity, expressed as integrated density values normalized to controls.
Fig. 6.
Fig. 6.
SNAP-25 phosphorylation after systemic KA treatment in mice. (A) Representative in situ hybridizations on coronal brain sections showing c-fos mRNA induction in the brain of mice treated with i.p. saline or KA (30 mg/kg). ent, entorhinal cortex; hip, hippocampus. (Scale bar: 2 mm.) (B) Representative immunoblots showing SNAP-25 phosphorylation in the hippocampus at different time points after 30 mg/kg KA i.p. Nonphosphorylated SNAP-25 was used as a control. (C) Quantification of SNAP-25 phosphorylation in the hippocampus, parietal cortex, and entorhinal cortex at different time points after KA treatment. Values are mean ± SE (n = 3–4 animals per time point).

References

    1. Bark IC. Mol Biol. 1993;5:67–76. - PubMed
    1. Bark IC, Hahn KM, Ryabinin AE, Wilson MC. Proc Natl Acad Sci USA. 1995;28:1510–1514. - PMC - PubMed
    1. Bark IC, Wilson MC. Gene. 1994;139:291–292. - PubMed
    1. Jahn R, Lang T, Sudhof TC. Cell. 2003;21:519–533. - PubMed
    1. Sudhof TC. Annu Rev Neurosci. 2004;27:509–547. - PubMed

Publication types