. 2008 Jan;211(Pt 2):180-6.
doi: 10.1242/jeb.013466.

A spatially explicit model of muscle contraction explains a relationship between activation phase, power and ATP utilization in insect flight

Affiliations

A spatially explicit model of muscle contraction explains a relationship between activation phase, power and ATP utilization in insect flight

Bertrand C W Tanner et al. J Exp Biol. 2008 Jan.

Abstract

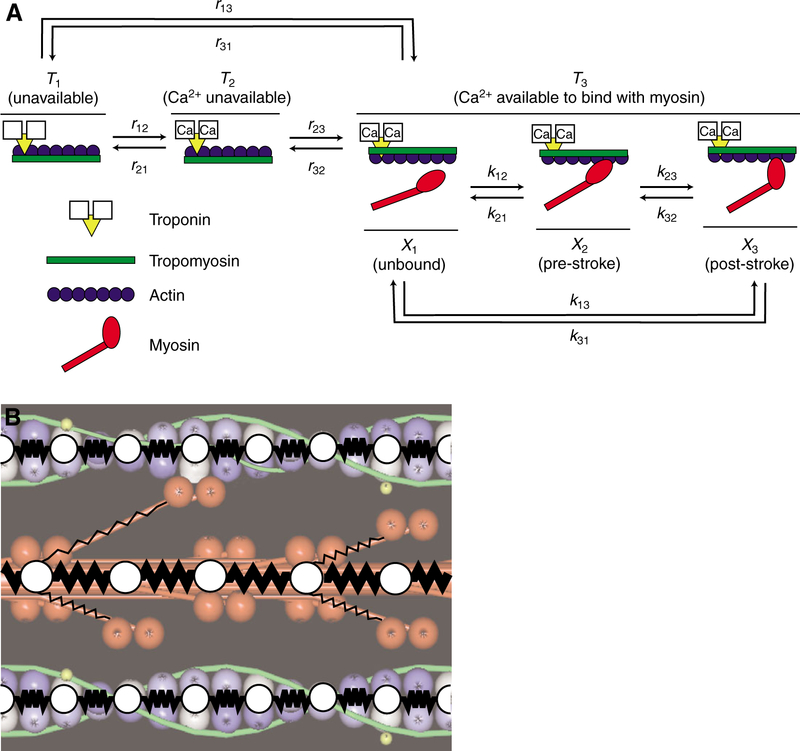
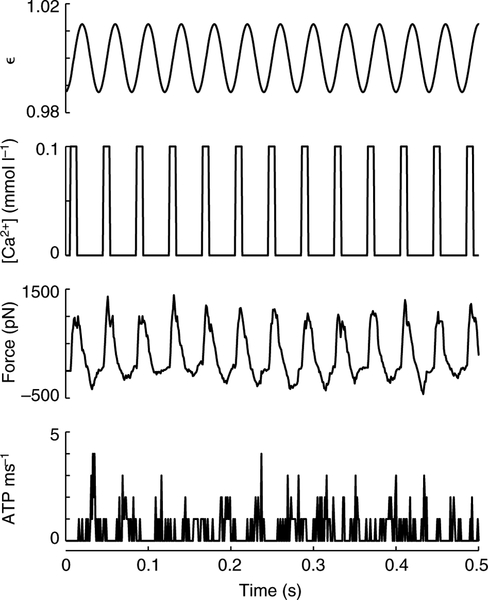
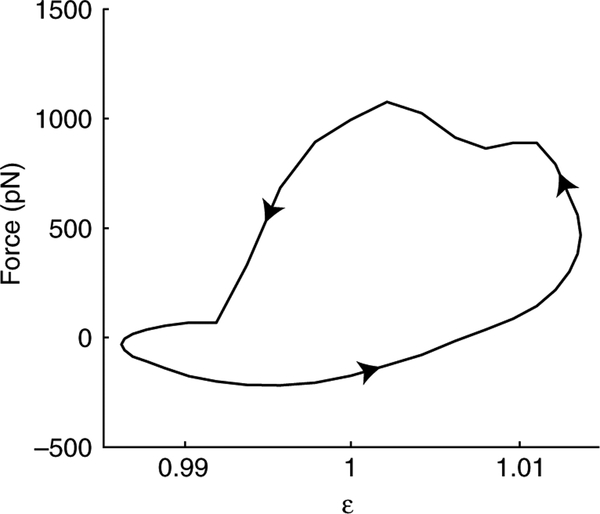
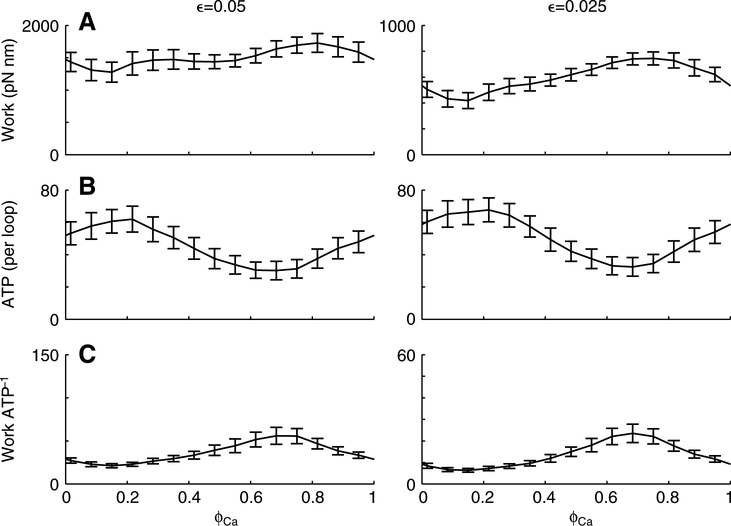
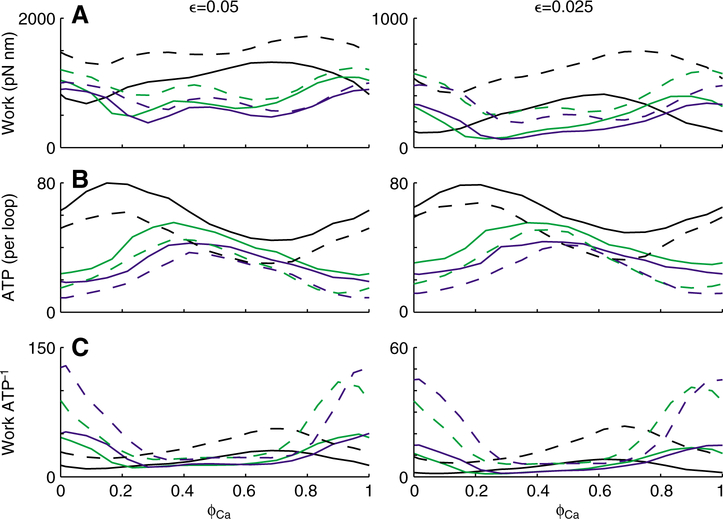
Using spatially explicit, stochastically kinetic, molecular models of muscle force generation, we examined the relationship between mechanical power output and energy utilization under differing patterns of length change and activation. A simulated work loop method was used to understand prior observations of sub-maximal power output in the dominant flight musculature of the hawkmoth Manduca sexta L. Here we show that mechanical work output and energy consumption (via ATP) vary with the phase of activation, although they do so with different phase sensitivities. The phase relationship for contraction efficiency (the ratio of power output to power input) differs from the phase relationships of energy consumption and power output. To our knowledge, this is the first report to suggest that ATP utilization by myosin cross-bridges varies strongly with the phase of activation in muscle undergoing cyclic length changes.


Figures

Fig. 1.
Fig. 1.
(A) Kinetics of thin filament regulation and cross-bridge cycling, modeled as coupled three-state cycles. Transition rates (kij) between cross-bridge states (X1X3) are strain dependent. Transition rates (rij) between thin filament states (T1T3) explicitly encode spatial information about troponin binding Ca2+ and tropomyosin movement. B) We simulated force production in a network of linear springs, using spring constants for thick filaments (km), thin filaments (ka) and cross-bridges (kxb). Thick and thin filament nodes (white circles between springs) represent modeled points from which cross-bridges extend from the thick filament backbone or actin binding sties along the thin filament where cross-bridges. At each time step, Monte-Carlo methods simulate likelihoods of Ca2+ regulated cross-bridge attachment to thin filaments, then forces balance about each node throughout the filament lattice.
Fig. 2.
Fig. 2.
Work loop simulations oscillated muscle length and intracellular Ca2+ concentration as a function of time, while monitoring force and ATP utilization. These panels show the initial half second of a simulation where muscle strain amplitude (ϵ, normalized peak to peak) was 0.025 and the Ca2+ transient had a 0.2 duty cycle (δCa) at a 0.033 phase of activation (ϕCa). Force and ATP utilization were calculated at each time step (dt=1 ms). Our standard mechanical parameters apply to these simulations: kxb=5, ka=5229 and km=6060 pN nm−1 (Tanner et al., 2007).
Fig. 3.
Fig. 3.
Each simulation (10 s long) produced 250 work loops, constructed from the phase portrait of force and muscle strain over any single oscillation period (40 ms). This work loop is the average phase portrait for the simulation shown in Fig. 2. The counter-clockwise direction (arrows) denotes positive work output (548.6±46.6 pN nm, mean ± s.d., N=245 work loops).
Fig. 4.
Fig. 4.
Work and ATP utilization vary with respect to the phase of Ca2+ activation (ϕCa). Data points (connected with a line) represent average values (mean ± s.d.) from 245 individual work loops at a duty cycle (δCa) of 0.5. The ϕCa values producing maxima and minima varied for work (A) and ATP (B), therefore yielding a unique ϕCa that maximized efficiency (ratio of work to ATP; C). Strain amplitude ϵ was 0.05 (left) and 0.025 (right), and primarily affected work magnitude. Note the difference in ordinate scales between the left and right panels in A and C when ϵ=0.05 versus 0.025. Mechanical parameters for the filaments and cross-bridges are listed in Fig. 2.
Fig. 5.
Fig. 5.
Duty cycle and filament stiffness influence how work and ATP vary with respect to phase of activation (ϕCa). Similar to Fig. 4, lines represent mean work (A), ATP (B) and efficiency (C) values; however error bars are not shown. Duty faction (δCa) varied between 0.1 (blue), 0.2 (green) and 0.5 (black). Broken lines represent our standard mechanical parameters for the filaments and cross-bridges, listed in Fig. 2. Therefore, the mean data shown in Fig. 4 correspond to the grey broken lines shown here in Fig. 5. Solid lines represent a more compliant filament lattice, where both ka and km were simultaneous scaled by a factor of 0.1 (kxb did not change). As in Fig. 4, note the difference in ordinate scale between the left and right panels in A and C when ϵ=0.05 (left) versus 0.025 (right).

References

    1. Chase PB, MacPherson JM and Daniel TL (2004). A spatially explicit model of the half sarcomere: myofilament compliance affects Ca2+ regulation. Ann. Biomed. Eng 32, 1559–1568. - PubMed
    1. Curtin N and Woledge R (1996). Power at the expense of efficiency in contraction of white muscle fibres from dogfish Scyliorhinus canicula. J. Exp. Biol 199, 593–601. - PubMed
    1. Daniel TL and Tu MS (1999). Animal movement: mechanical tuning and coupled systems. J. Exp. Biol 202, 3415–3421. - PubMed
    1. Daniel TL, Trimble AC and Chase PB (1998). Compliant realignment of binding sites in muscle: transient behavior and mechanical tuning. Biophys. J 74, 1611–1621. - PMC - PubMed
    1. Dickinson MH and Lighton JRB (1995). Muscle efficiency and elastic storage in the flight motor of Drosophila. Science 268, 87–90. - PubMed

Publication types

Substances