

Analysis of sequence conservation at nucleotide resolution
- PMID: 18166073
- PMCID: PMC2230682
- DOI: 10.1371/journal.pcbi.0030254
Analysis of sequence conservation at nucleotide resolution
Abstract
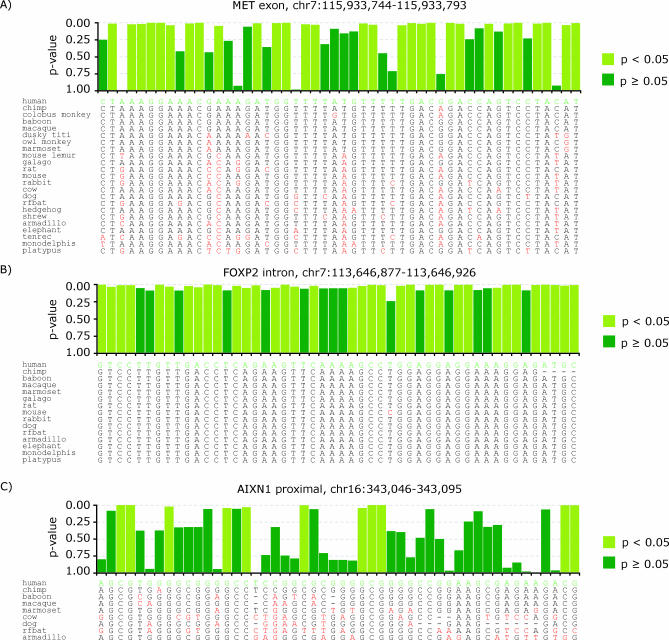
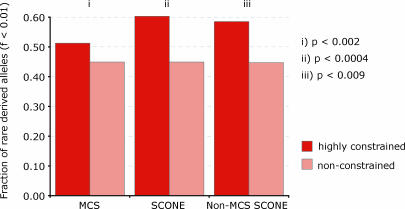
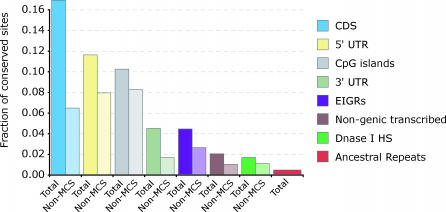
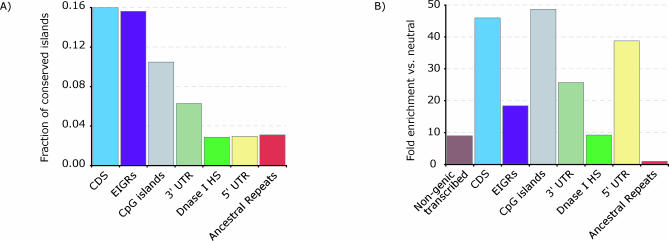
One of the major goals of comparative genomics is to understand the evolutionary history of each nucleotide in the human genome sequence, and the degree to which it is under selective pressure. Ascertainment of selective constraint at nucleotide resolution is particularly important for predicting the functional significance of human genetic variation and for analyzing the sequence substructure of cis-regulatory sequences and other functional elements. Current methods for analysis of sequence conservation are focused on delineation of conserved regions comprising tens or even hundreds of consecutive nucleotides. We therefore developed a novel computational approach designed specifically for scoring evolutionary conservation at individual base-pair resolution. Our approach estimates the rate at which each nucleotide position is evolving, computes the probability of neutrality given this rate estimate, and summarizes the result in a Sequence CONservation Evaluation (SCONE) score. We computed SCONE scores in a continuous fashion across 1% of the human genome for which high-quality sequence information from up to 23 genomes are available. We show that SCONE scores are clearly correlated with the allele frequency of human polymorphisms in both coding and noncoding regions. We find that the majority of noncoding conserved nucleotides lie outside of longer conserved elements predicted by other conservation analyses, and are experiencing ongoing selection in modern humans as evident from the allele frequency spectrum of human polymorphism. We also applied SCONE to analyze the distribution of conserved nucleotides within functional regions. These regions are markedly enriched in individually conserved positions and short (<15 bp) conserved "chunks." Our results collectively suggest that the majority of functionally important noncoding conserved positions are highly fragmented and reside outside of canonically defined long conserved noncoding sequences. A small subset of these fragmented positions may be identified with high confidence.
Conflict of interest statement
Figures
References
-
- Koonin EV, Galperin MY. Sequence—evolution—function: computational approaches in comparative genomics. Boston: Kluwer Academic; 2003. p. xiii.461. p., 411 plates. - PubMed
-
- Ponting CP, Schultz J, Copley RR, Andrade MA, Bork P. Evolution of domain families. Adv Protein Chem. 2000;54:185–244. - PubMed
-
- Gaucher EA, Gu X, Miyamoto MM, Benner SA. Predicting functional divergence in protein evolution by site-specific rate shifts. Trends Biochem Sci. 2002;27:315–321. - PubMed
-
- Lichtarge O, Sowa ME. Evolutionary predictions of binding surfaces and interactions. Curr Opin Struct Biol. 2002;12:21–27. - PubMed
-
- Hurst LD. The Ka/Ks ratio: diagnosing the form of sequence evolution. Trends Genet. 2002;18:486. - PubMed
Publication types
MeSH terms
Grants and funding
LinkOut - more resources
Full Text Sources
