. 2008 Jan;13(1):69-80.
doi: 10.1016/j.ccr.2007.12.005.

Epigenetic-mediated dysfunction of the bone morphogenetic protein pathway inhibits differentiation of glioblastoma-initiating cells

Affiliations

Epigenetic-mediated dysfunction of the bone morphogenetic protein pathway inhibits differentiation of glioblastoma-initiating cells

Jeongwu Lee et al. Cancer Cell. 2008 Jan.

Abstract

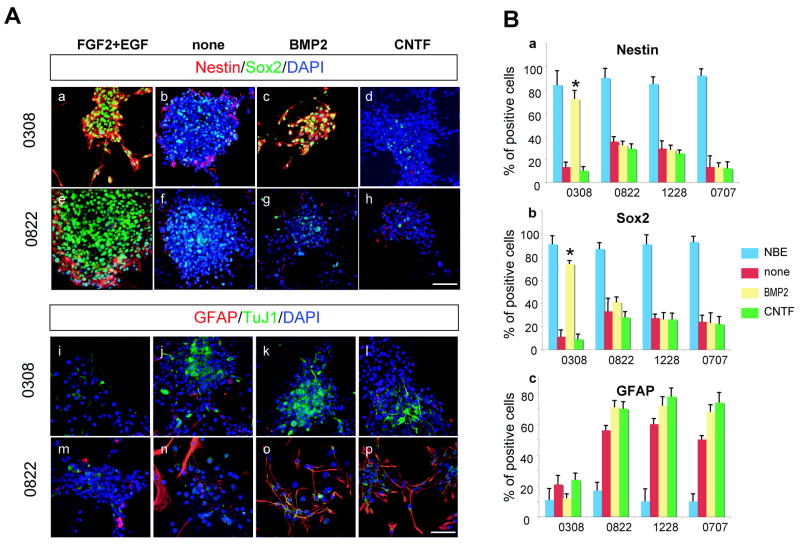
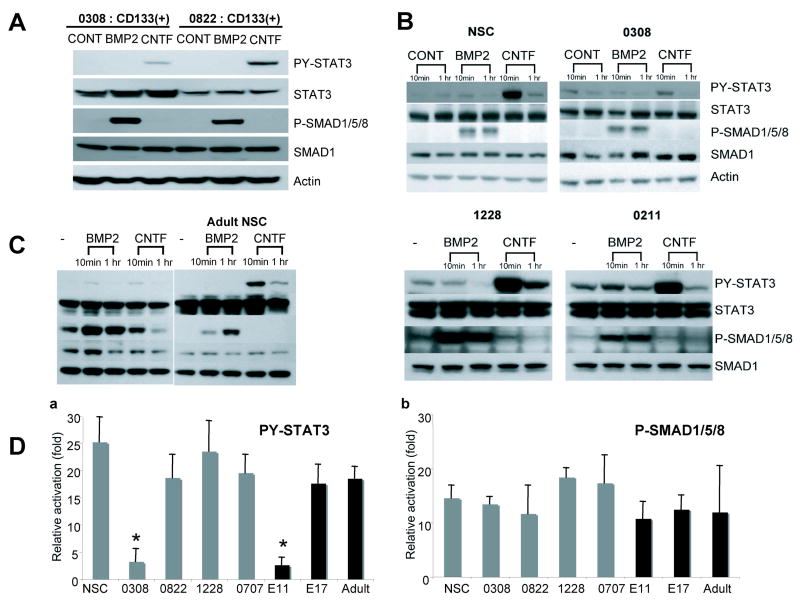
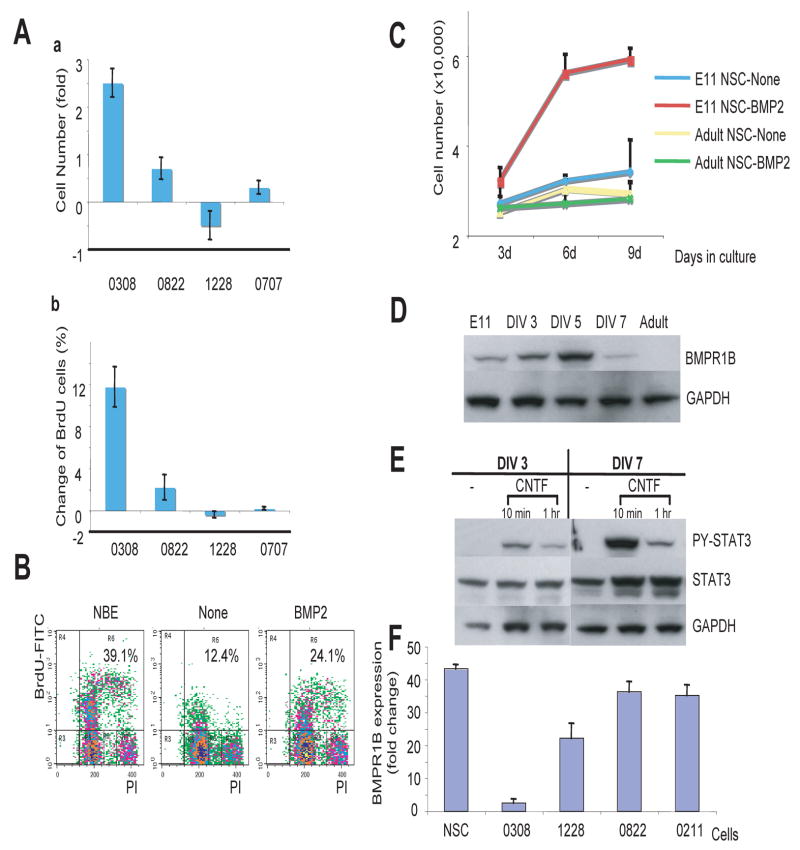
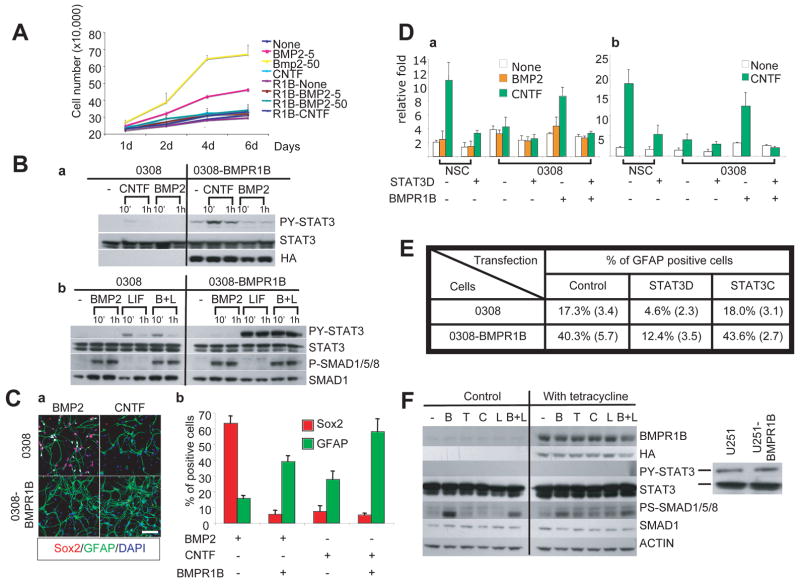
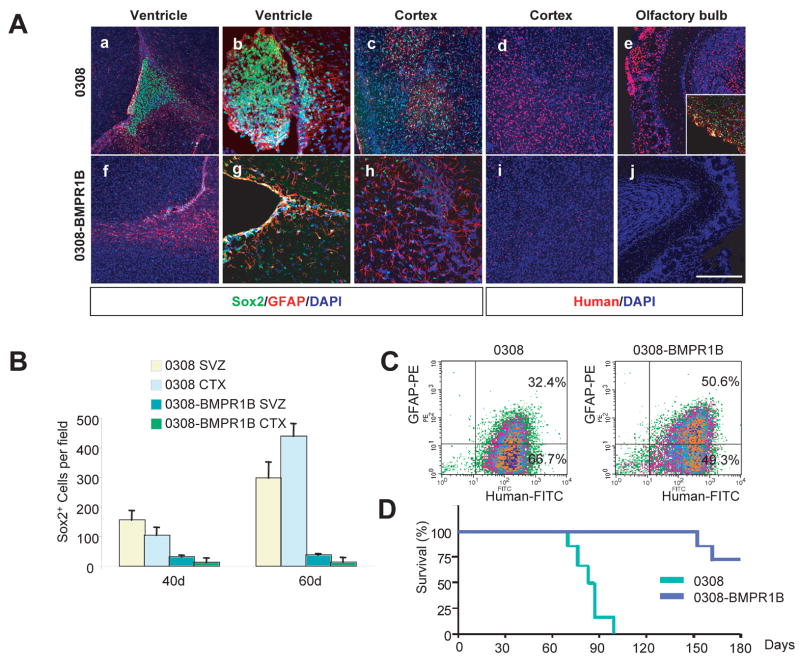
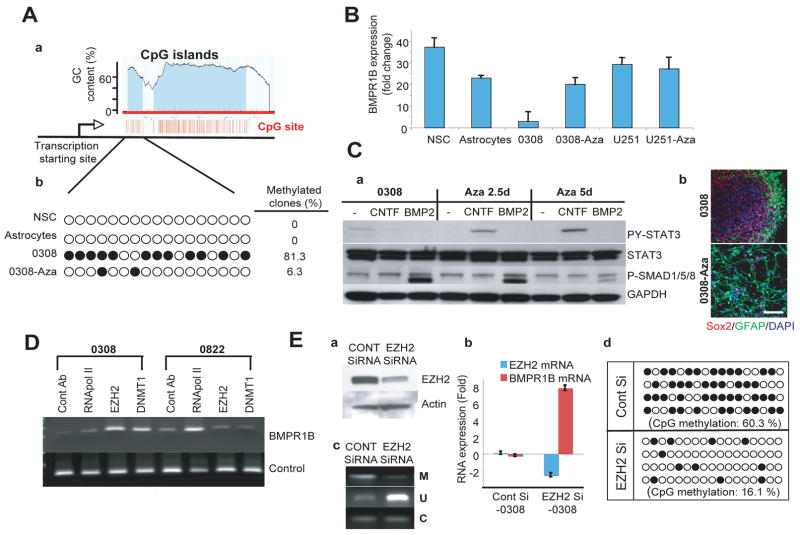
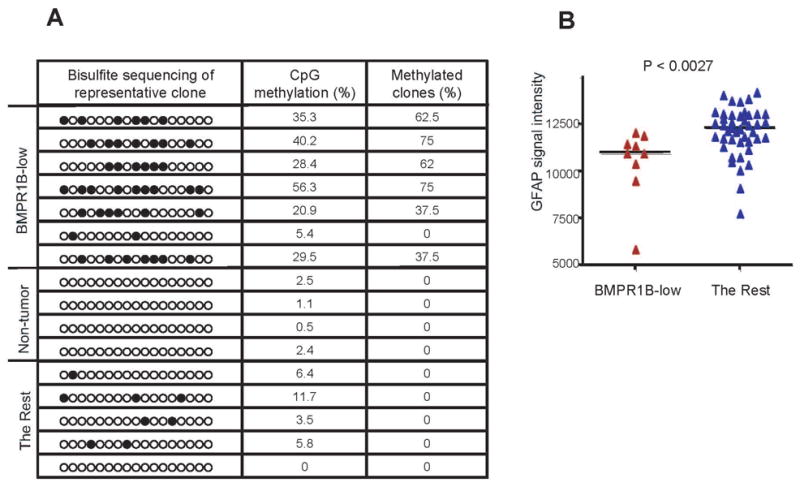
Despite similarities between tumor-initiating cells with stem-like properties (TICs) and normal neural stem cells, we hypothesized that there may be differences in their differentiation potentials. We now demonstrate that both bone morphogenetic protein (BMP)-mediated and ciliary neurotrophic factor (CNTF)-mediated Jak/STAT-dependent astroglial differentiation is impaired due to EZH2-dependent epigenetic silencing of BMP receptor 1B (BMPR1B) in a subset of glioblastoma TICs. Forced expression of BMPR1B either by transgene expression or demethylation of the promoter restores their differentiation capabilities and induces loss of their tumorigenicity. We propose that deregulation of the BMP developmental pathway in a subset of glioblastoma TICs contributes to their tumorigenicity both by desensitizing TICs to normal differentiation cues and by converting otherwise cytostatic signals to proproliferative signals.


Figures

Figure 1
Figure 1. Immunohistochemical analysis of various TICs cultured in the presence of differentiation-inducing cytokines
A) Representative microphotographs of 0308 and 0822 TICs cultured in the presence of various cytokines. Each column represents the same culture condition., (a–h) Immunohistochemistry of Nestin and Sox2 in 0308 TICs (a to d) and 0822 TICs (e to h). (i–p) Immunohistochemistry of GFAP and TuJ1 in 0308 TICs (i to l) and 0822 TICs (m to p). DAPI staining (blue) was used to identify nuclei. White bars represent 10 micron. B) Differentiation potentials of various TICs after exposure to cytokines. Error bars represent SD (performed in triplicate). * indicates p< 0.01.
Figure 2
Figure 2. Evaluation of representative activators of Jak/STAT and BMP pathways in various TICs
A) Western blot analysis of representative activators of Jak/STAT and BMP pathways in CD133+ TICs. Cells were stimulated with indicated cytokines (50 ng/ml) for 20 minutes. PY-STAT3 indicates detection of tyrosine 705-phosphorylated form of STAT3. STAT3 indicates detection of all STAT3 proteins regardless of phosphorylation status. PS-SMAD1/5/8 and SMAD1 indicate serine phosphorylated SMAD and total SMAD levels, respectively. B and C) Western blot analysis of PY-STAT3 and PS-SMAD1/5/8 in various TICs and normal human NSCs (B) and mouse NSCs from different developmental stages (C). D) Relative activation of PY-STAT3 and PS-SMAD1/5/8 in various TICs and normal NSCs upon cytokine exposure. Relative activation of PY-STAT3 in a given condition was measured by relative intensity of PY-STAT3 over that of STAT3 bands compared to non-treated control. Error bars represent SD.
Figure 3
Figure 3. BMP induces proliferation instead of differentiation of 0308 TICs
A) Proliferation kinetics of various TICs in the presence of BMP2. Cells were cultured with BMP2 (without FGF2 and EGF) for 6 days. Cell number (a) and BrdU positive cells (b) were counted and relative changes were calculated compared to non-treated cells. Error bars represent SD. B) FACS analysis of BrdU incorporation in 0308 TICs. Percentages indicate BrdU-positive cells. C) Proliferation kinetics of mouse NSCs from different developmental stages. Error bars represent SD. D and E) Western blot analysis of BMPR1B and PY-STAT3 in serially cultured NSCs isolated from E11 brains and adult-SVZ derived mouse NSCs. DIV represents days in vitro. GAPDH was used to confirm equal loading of proteins. F) Quantitative mRNA expression level of BMPR1B in various TICs and human NSCs determined by real time RT-PCR analysis. Error bars represent SD.
Figure 4
Figure 4. Overexpression of BMPR1B in 0308-TICs enhances astroglial differentiation
A) Proliferation kinetics of BMPR1B-0308 cells cultured in BMP2 and CNTF (without FGF2 and EGF). Error bars represent SD. B) Western blot analysis of representative activators of Jak/STAT and BMP pathways in 0308 and BMPR1B-0308 cells treated with indicated cytokines (BMP2: 50 ng/ml, CNTF: 50 ng/ml, LIF: 100 ng/ml). Exogenous BMPR1B expression was monitored by expression of HA tag which was fused with BMPR1B protein. C) Increased astroglial differentiation in 0308-BMPR1B cells. a. Representative immunohistochemical staining of BMPR1B-0308 cells cultured in the presence of BMP2 or CNTF (50 ng/ml each). Cytokines were added every other day (in the absence of FGF2 and EGF) for 5 days. White bar represents 10 micron. b. Quantitation of Sox2 and GFAP-positive cells in (a). Error bars represent SD. D) Transcriptional activity assay of synthetic STAT3-responsive promoter (a) and genomic GFAP promoter (b) in 0308 cells and human NSCs. Cells were co-transfected with a plasmid containing a STAT3-responsive or genomic GFAP promoter driving luciferase expression and a plasmid containing a CMV promoter driving beta-galactosidase expression. Y axis represents relative activity of luciferase versus beta-galactosidase activity. Error bars represent SD. E) Quantitation of GFAP-positive cells after modulation of STAT3 activity in 0308 and 0308-BMPR1B cells. Cells were transiently transfected with either empty vector control, STAT3D, or STAT3C vectors and processed for GFAP staining 4 days after transfection. % of GFAP positive cells among transfected cells are shown. Data shown were from a representative experiment and numbers in parenthesis represent SD. F) Western blot analysis of PY-STAT3 and PS-SMAD1/5/8 in tetracycline inducible U251-BMPR1B cells. Cells were serum-starved overnight prior to the addition of various cytokines (B, BMP2; T, TGF-β; C, CNTF; L, LIF). Actively proliferating U251 or U251-BMPR1B cells in serum containing media reveals PY-STAT3 (right).
Figure 5
Figure 5. Overexpression of BMPR1B in 0308 cells decreased tumorigenicity in vivo
A) Representative immunohistochemistry of tumors derived from 0308 and 0308-BMPR1B cells at 40 days (a–c and f–h) and 60-days (d and e, i and j). Note that GFAP antibody recognizes both human and mouse GFAP proteins. Inset in (e) demonstrates immnuostaining of Sox2 (green) and GFAP (red). DAPI staining (blue) was used to reveal anatomic locations in brains. White bars represent 100 micron. B) Quantitation of Sox2 positive cells in tumors derived from 0308 and 0308-BMPR1B cells. SVZ and CTX indicate subventricular zones and cortex, respectively. Error bars represent SD. C) FACS analysis of GFAP expression in 0308 and 0308-BMPR1B-derived tumor cells. D) Survival of animals injected with 0308 (n = 8) and 0308-BMPR1B cells (n = 7) (log-rank test: P < 0.001).
Figure 6
Figure 6. Expression of BMPR1B in 0308-TICs is silenced by hypermethylation of BMPR1B promoter and restored by demethylation or knockdown of EZH2
A) Methylation sequencing of BMPR1B promoter region in various cells. a. The diagram depicts the predicted CpG islands near the BMPR1B promoter region (Li and Dahiya, 2002). The transcription start site of BMPR1B (indicated by arrow; designates as 1 in this diagram) is base pair 96036306 on chromosome 4 (Genome Browser). Each CpG nucleotide is depicted as a red vertical line. b. Methylation status of CpG islands by bisulfite genomic sequencing. Each circle represents a CpG nucleotide site. Filled circles indicate methylated CpG. Percentage of methylated clones (more than 25% of CpG sites are methylated) was calculated from 16 individual clones for each cell. B) Real time RT-PCR analysis of BMPR1B expression in 0308 TICs and normal cells. Relative expression level of BMPR1B was evaluated by Cτ method. Error bars represent SD (performed in triplicate). C) Increased astroglial differentiation of 0308 TICs treated with Aza-Cd. a. Western blot analysis of PY-STAT3 and PS-SMAD1/5/8 in 0308 cells treated with Aza-Cd. GAPDH was used as a loading control. b. Representative immunostaining microphotographs of 0308 cells with or withour Aza-Cd treatment. White bar represents 10 micron. D) Chromatin immunoprecipitation of BMPR1B promoter region in 0308 and 0822-TICs. Antibodies used for immunoprecipitation are shown above. DNA products shown in the lower row served as PCR efficiency control. E) Expression of BMPR1B and methylation status of its promoter in EZH2-siRNA treated 0308 TICs. a. Western blot analysis of EZH2 expression in EZH2 siRNA treated 0308 cells. Three days after siRNA treatment, cells were harvested for analysis. Actin was used as a loading control. b. Real time RT-PCR analysis of EZH2 and BMPR1B mRNA expression in EZH2 siRNA-treated 0308 TICs. Error bars represent SD (performed in triplicate). c. Methylation status of the BMPR1B promoter region in EZH2 siRNA-treated 0308 cells as determined by a methylation-specific PCR assay. M, methylated; U, unmethylated; C, control PCR primers. d. Bisulfite genomic sequencing analysis for CpG methylation following knockdown of EZH2. Each line is the result from an individual clone.
Figure 7
Figure 7. Methylation status of BMPR1B promoter in human GBMs
A) Methylation status of the BMPR1B promoter region in human GBMs. Each circle represents CpG nucleotides. The extent CpG methylation (%) and frequency of methylated clones were determined as shown in Figure 6. Eight clones for each sample were sequenced. B) Correlation between the mRNA expression level of BMPR1B and GFAP in a subset of human GBMs. Expression levels of GFAP were compared between the BMPR1B-low mRNA expression group (defined as GBMs with more than 3 fold-reduction in median BMPR1B expression compared to all other GBMs) and all other GBM tissues. Median GFAP expression value was shown as a horizontal line. (two-tailed t test; p <0.0027).

Comment in

  • BMPing off glioma stem cells.
    Nakano I, Saigusa K, Kornblum HI. Nakano I, et al. Cancer Cell. 2008 Jan;13(1):3-4. doi: 10.1016/j.ccr.2007.12.018. Cancer Cell. 2008. PMID: 18167333

References

    1. Androutsellis-Theotokis A, Leker RR, Soldner F, Hoeppner DJ, Ravin R, Poser SW, Rueger MA, Bae SK, Kittappa R, McKay RD. Notch signalling regulates stem cell numbers in vitro and in vivo. Nature. 2006;442:823–826. - PubMed
    1. Bao S, Wu Q, McLendon RE, Hao Y, Shi Q, Hjelmeland AB, Dewhirst MW, Bigner DD, Rich JN. Glioma stem cells promote radioresistance by preferential activation of the DNA damage response. Nature. 2006;444:756–760. - PubMed
    1. Bernstein BE, Meissner A, Lander ES. The mammalian epigenome. Cell. 2007;128:669–681. - PubMed
    1. Bonnet D, Dick JE. Human acute myeloid leukemia is organized as a hierarchy that originates from a primitive hematopoietic cell. Nat Med. 1997;3:730–737. - PubMed
    1. Bonni A, Sun Y, Nadal-Vicens M, Bhatt A, Frank DA, Rozovsky I, Stahl N, Yancopoulos GD, Greenberg ME. Regulation of gliogenesis in the central nervous system by the JAK-STAT signaling pathway. Science. 1997;278:477–483. - PubMed

Publication types

MeSH terms

Substances

Associated data