. 2008 Jan 2;3(1):e1374.
doi: 10.1371/journal.pone.0001374.

Extent of beta cell destruction is important but insufficient to predict the onset of type 1 diabetes mellitus

Affiliations

Extent of beta cell destruction is important but insufficient to predict the onset of type 1 diabetes mellitus

David J Klinke 2nd. PLoS One. .

Abstract

Background: Type 1 diabetes mellitus is characterized by an inability to produce insulin endogenously. Based on a series of histopathology studies of patients with recent onset of the disease, it is commonly stated that the onset of clinical symptoms corresponds to an 80-95% reduction in beta cell mass. Motivated by the clinical importance of the degree of beta cell destruction at onset, a meta-analysis was used to determine the validity of this common wisdom.

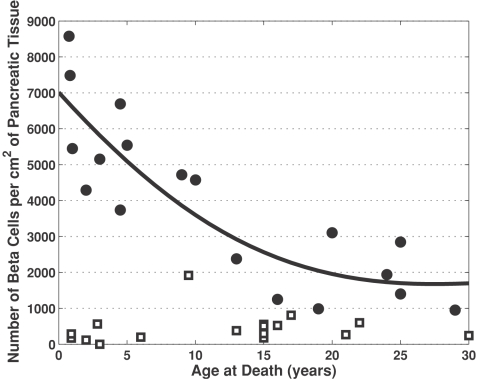
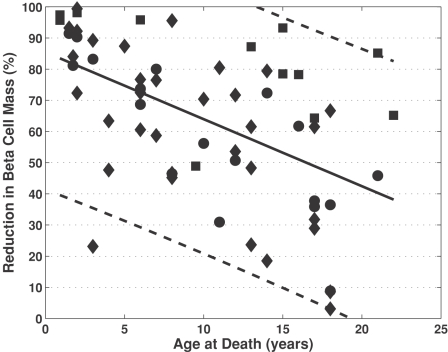
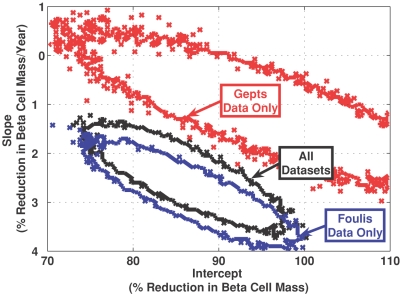
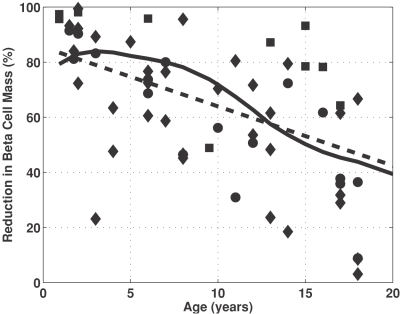
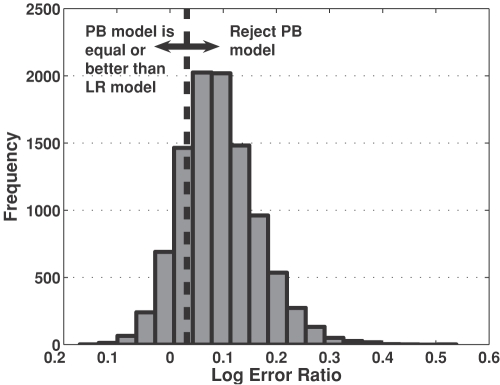
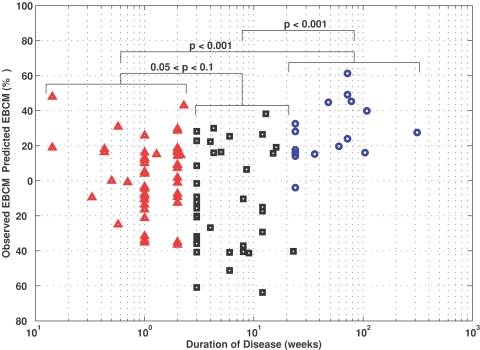
Methods and findings: The histopathology results identifying insulin containing islets in patients younger than 20 years of age were extracted from three different studies. The results for 105 patients were stratified by duration of diabetic symptoms and age at onset. Linear regression and a non-parametric bootstrap approach were used to determine the dependence of residual beta cell mass to age at onset. The percentage reduction in beta cell mass was highly correlated (p<0.001) with the age of onset with the greatest reduction in beta cell mass in the youngest patients. As this trend had not been previously observed, an alternative physiology-based model is proposed that captures this age-dependence.

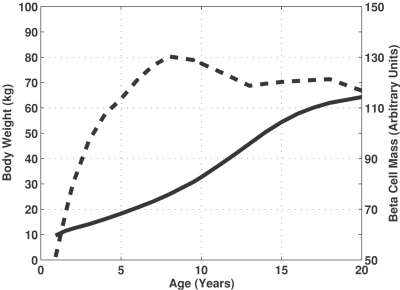
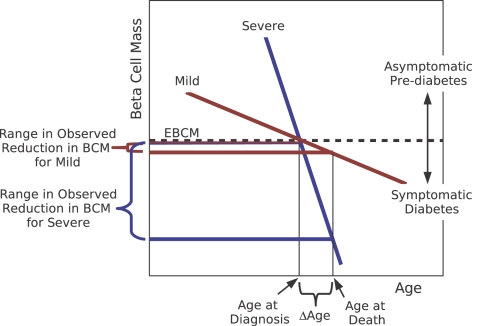
Conclusions: The severity in beta cell reduction at onset decreased with age where, on average, a 40% reduction in beta cell mass was sufficient to precipitate clinical symptoms at 20 years of age. The observed trend was consistent with a physiology-based model where the threshold for onset is based upon a dynamic balance between insulin-production capacity, which is proportional to beta cell mass, and insulin demand, which is proportional to body weight.


Conflict of interest statement

Competing Interests: The author has declared that no competing interests exist.

Figures

Figure 1
Figure 1. The density of beta cells within a cross-section of a pancreas as a function of age.
The density of beta cells were reported for non-diabetic controls (filled circles) and Type 1 diabetics (open squares) reported by Gepts . A non-linear regression was used to estimate the expected density of beta cells in non-diabetic controls as a function of age (solid line). In diabetics, the percentage reduction in beta cell mass is estimated by the ratio of the observed beta cell density in diabetics to the expected density provided by the non-linear regression.
Figure 2
Figure 2. The reduction in beta cell mass is highly variable and depends on age of diagnosis.
The data points, shown as black symbols, summarizes the percentage reduction in beta cell mass in 63 subjects that died within three weeks of diagnosis of type 1 diabetes mellitus from three different studies (squares , diamonds , and circles [8]). The solid line represents the linear regression to the patients with recent onset type 1 diabetes mellitus. The 95% confidence intervals that enclose the population of recent onset type 1 diabetics patients are shown by the dashed lines.
Figure 3
Figure 3. A computational Bayesian estimate of the two-dimensional 95% confidence regions for the linear regression parameters.
The confidence regions for the slope and intercept were estimated from the Gepts data (red) , Foulis et al. data (blue) , , and combined data (black). The curves indicate the parameter values that are enclosed within 95% of the posterior probability density function. The confidence regions associated with the combined data is a non-linear combination of the confidence regions associated with the Gepts data only and the Foulis et al. data only.
Figure 4
Figure 4. The growth rates for beta cell mass and total body weight exhibit different kinetics.
The changes in beta cell mass (dotted line) and body weight in kg (solid line) are shown a function of age. The beta cell mass is the product of beta cell density and volume of the pancreas . The change in body weight as a function of age is an average value from male and female growth charts .
Figure 5
Figure 5. Comparison of the observed reduction in beta cell mass versus the LR and PB models.
Comparison of the estimate of excess beta cell mass (solid curve) compared against the trend obtained by linear regression (dotted line) for the measured reduction in beta cell mass in 63 patients that died within three weeks of diagnosis of type 1 diabetes mellitus from three different studies (squares , diamonds , and circles [8]).
Figure 6
Figure 6. Frequency of values for LER determined via bootstrap resampling with replacement of the residuals.
The dotted line corresponds to the AIC threshold for rejecting the PB model. Rejection of the PB model is not statistically significant as the associated p-value equals 0.19.
Figure 7
Figure 7. The variance in PB model residuals depends on duration of diabetic symptoms.
The observed reduction in beta cell mass for all patients minus the predicted excess beta cell mass matched for age plotted as a function of duration of diabetic symptoms. Patients are grouped into three subsets. The first subset is patients who died within three weeks of diagnosis (red triangles). The second subset is patients who died between three and 23 weeks following diagnosis (black squares). The third subset is patients who died greater than 23 weeks following diagnosis (blue circles). Patients who died greater than 23 weeks following diagnosis exhibited a greater reduction in beta cell mass compared to other groups. The p-values indicate the level of confidence associated with the hypothesis that the mean residual values are different between the two groups.
Figure 8
Figure 8. The influence of disease severity on the range of observed reduction in beta cell mass.
The diagnosis for Type 1 diabetes occurs once the beta cell mass declines to a point where the excess beta cell mass (EBCM) is depleted (dotted line). The range of observed reduction in beta cell mass is greater in patients with severe autoimmunity to beta cells compared to patients with mild autoimmunity when Δage is greater than zero. As Δage is decreased, the difference in observed reduction in beta bell mass is also decreased.

References

    1. World Health Organization. 1999. Report of a WHO consultation. Part 1: Diagnosis and classification of diabetes mellitus. Technical report, World Health Org, Geneva.
    1. Atkinson MA, Eisenbarth GS. Type 1 diabetes: New perspectives on disease pathogenesis and treatment. Lancet. 2001;358:221–229. - PubMed
    1. Herold KC, Hagopian W, Auger JA, Poumian-Ruiz E, Taylor L, et al. Anti-CD3 monoclonal antibody in new-onset Type 1 diabetes mellitus. New Engl J Med. 2002;346:1692–1698. - PubMed
    1. Silverstein J, Klingensmith G, Copeland K, Plotnick L, Kaufman F, et al. Care of children and adolescents with Type 1 diabetes: A statement of the American Diabetes Association. Diabetes Care. 2005;28:186–212. - PubMed
    1. Diabetes Control and Complications Trial Research Group. Effect of intensive therapy on the microvascular complications of Type 1 diabetes mellitus. JAMA. 2002;287:2563–2569. - PMC - PubMed

Publication types

LinkOut - more resources