. 2008 Jan 2;3(1):e1387.
doi: 10.1371/journal.pone.0001387.

The OSU1/QUA2/TSD2-encoded putative methyltransferase is a critical modulator of carbon and nitrogen nutrient balance response in Arabidopsis

Affiliations

The OSU1/QUA2/TSD2-encoded putative methyltransferase is a critical modulator of carbon and nitrogen nutrient balance response in Arabidopsis

Peng Gao et al. PLoS One. .

Abstract

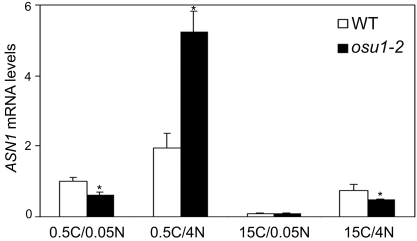
The balance between carbon (C) and nitrogen (N) nutrients must be tightly coordinated so that cells can optimize their opportunity for metabolism, growth and development. However, the C and N nutrient balance perception and signaling mechanism remains poorly understood. Here, we report the isolation and characterization of two allelic oversensitive to sugar 1 mutants (osu1-1, osu1-2) in Arabidopsis thaliana. Using the cotyledon anthocyanin accumulation and root growth inhibition assays, we show that the osu1 mutants are more sensitive than wild-type to both of the imbalanced C/N conditions, high C/low N and low C/high N. However, under the balanced C/N conditions (low C/low N or high C/high N), the osu1 mutants have similar anthocyanin levels and root lengths as wild-type. Consistently, the genes encoding two MYB transcription factors (MYB75 and MYB90) and an Asn synthetase isoform (ASN1) are strongly up-regulated by the OSU1 mutation in response to high C/low N and low C/high N, respectively. Furthermore, the enhanced sensitivity of osu1-1 to high C/low N with respect to anthocyanin accumulation but not root growth inhibition can be suppressed by co-suppression of MYB75, indicating that MYB75 acts downstream of OSU1 in the high C/low N imbalance response. Map-based cloning reveals that OSU1 encodes a member of a large family of putative methyltransferases and is allelic to the recently reported QUA2/TSD2 locus identified in genetic screens for cell-adhesion-defective mutants. Accumulation of OSU1/QUA2/TSD2 transcript was not regulated by C and N balance, but the OSU1 promoter was slightly more active in the vascular system. Taken together, our results show that the OSU1/QUA2/TSD2-encoded putative methyltransferase is required for normal C/N nutrient balance response in plants.


Conflict of interest statement

Competing Interests: The authors have declared that no competing interests exist.

Figures

Figure 1
Figure 1. Isolation and characterization of the osu1 mutants.
Seedlings shown in this figure were all grown in the commercially prepared 1/2 MS medium which contained 30 mM total N (30N) for seven days. For (D-F), the average of anthocyanin contents from three replicates, each with 8–10 seedlings, is shown, with the bar representing the SD. Statistical analysis by one way ANOVA; the asterisk (*) above the column indicates a significant difference (p<0.05) between osu1-1 or osu1-2 and wild-type (WT) under the same nutrient condition. (A) T3 seedlings of the two PROP2:GUS lines (23G13-2 and 23G9-8) exhibited segregation of reddish purple cotyledons (indicated by arrows) and normal green cotyledons when grown in the presence of 1% sucrose (approximately 30 mM Suc, designated 30C) and 50 µg/mL hygromycin. Other T3 seedlings from the two parental plants (23G13-4 and 23G9-1) did not show such a phenotype. (B) Failure of 23G13-2 to complement 23G9-8-1 under 120 mM sucrose. 13-2 represents 23G13-2, which is designated osu1-1; 9-8-1 represents 23G-9-8-1, which is designated osu1-2; F1, the progeny from the cross of osu1-1 X osu1-2. (C) The two mutants, osu1-1 and osu1-2, showed enhanced sensitivities to increasing concentrations of sucrose (0C to 210C) at 30N after 7 days of vertical growth. For 30C/30N+180 Man, 180 mM of mannitol was added to the medium containing 30 mM Suc, so that the total carbohydrate concentration of the medium was equivalent to 210 mM Suc. (D) Quantitative analysis of cotyledon anthocyanin accumulation in response to various Suc (C) concentrations at 30N. FW, fresh weight. (E) Quantitative analysis of cotyledon anothcyanin accumulation in response to the same concentration (210 mM) of Suc, glucose (Glc) and Mannitol (Man). No sugar supplementation was used as the control. (F) Quantitative analysis of cotyledon anothcyanin accumulation in response to various concentrations of maltose and 3-O-methylglucose (OMG). No sugar supplementation was used as the control.
Figure 2
Figure 2. The osu1 mutants increase the sensitivity to the imbalanced C/N.
(A) Representative seedlings of WT, osu1-1, and osu1-2 after seven days of growth on 0.5C/0.05N, 0.5C/4N, 15C/0.05N, and 15C/4N. (B) Quantitative analysis of cotyledon anthocyanin accumulation under various C/N conditions. Cotyledons excised from the 7-day-old seedlings were used to measure anthocyanin levels in relative units per g of fresh weight (FW). Shown are the average and the SD of three replicates, each with 8–10 seedlings. (C) Quantitative analysis of root growth inhibition under various C/N. Primary root lengths were measured. The average of four replicates (each with 8–10 seedlings) is shown, with the bar representing the SD. Statistical analysis by one way ANOVA; the asterisk (*) above the column indicates a significant difference (p<0.05) between osu1-1 or osu1-2 and wild-type (WT) under the same C/N condition.
Figure 3
Figure 3. osu1 does not increase the sensitivity to phosphate and sulphate nutrient deficiency-activated anthocyanin accumulation.
(A) Anthocyanin accumulation under phosphate deficiency. Seeds were germinated and grown vertically on two C/N (0C/4N or 15C/4N) conditions with various phosphate (P) concentrations (0, 0.05, and 1.25 mM) for seven days. The average of three replicates (each with 6–8 seedlings) is shown, with the bar representing the SD. (B) Anthocyanin accumulation under sulphate deficiency. Seven-day-old seedlings vertically grown on the 15C/4N plates were transferred to liquid 0C/4N or 15C/4N medium supplemented with various sulphate (S) concentrations (0.0001, 0.0301, and 1.6001 mM) for additional three days. The average of three replicates (each with 5 or 6 seedlings) is shown, with the bar representing the SD. FW, fresh weight. Statistical analysis by one way ANOVA; the asterisk (*) above the column indicates a significant difference (p<0.05) between osu1-1 or osu1-2 and wild-type (WT) under the same C/N/P or C/N/S condition.
Figure 4
Figure 4. OSU1 acts upstream of MYB75 in response to high C/low N.
(A and B) The OSU1 mutations altered MYB75 and MYB90 expression in response to high C/low N. Four-day-old WT, osu1-1 and osu1-2 seedlings grown vertically on 15C/4N were transferred to freshly prepared media with four different C/N conditions for three days of treatment. MYB75 (A) and MYB90 (B) mRNA levels were normalized with those of the reference (ACT2), and the relative MYB75 or MYB90 mRNA level under 0.5C/0.05N was set at 1. The average and the SD bar for MYB75 (n = 4) and MYB90 (n = 3) are shown. (C) RT-PCR analysis of MYB75 expression in MYB75 sense (#16, 20 and 24) and dominant negative SRDX lines (#13 and 17). Primers were used to amplify both endogenous and transgenic MYB75 expression. ACT2, an internal control. (D) Anthocyanin accumulation of the transgenic lines under high C/low N. The averages and SDs of three replicates, each with 10-15 seedlings, are shown. FW, fresh weight. (E and F) The MYB75 co-suppression line (Sense #24) is epistatic to osu1-1 at high C/low N. (E) Anthocyanin levels, and (F) root lengths at four different C/N conditions, each with four replicates. osu1-1/Sense #24 represents a homozygous line of osu-1 and MYB75 co-suppression. Statistical analysis by one way ANOVA; the asterisk (*) above the column indicates a significant difference (p<0.05) from wild-type (WT) under the same C/N condition.
Figure 5
Figure 5. OSU1 suppresses ASN1 expression in response to low C/high N.
Seedlings were treated with various C/N conditions and real-time RT-PCR analysis was performed as described in Figure 4 legend. mRNA levels were normalized with those of the ACT2 reference, and the relative ASN1 mRNA level under 0.5C/0.05N was set at 1. The bar represents the SD of three replicates. Statistical analysis by t-test; the asterisk (*) above the osu1-2 column indicates a significant difference (p<0.05) from wild-type (WT) under the same C/N condition.
Figure 6
Figure 6. Molecular cloning of the OSU1 gene.
(A) A diagram showing the osu1 mutant gene mapping. The number of recombinants (chromosomes) is indicated for each marker used on the BAC clones. The name and the primers for each marker are listed in Table S1. The osu1-1 mutant gene is mapped to a region between two markers (470560 on the BAC clone T11I11, and (470251 on the BAC clone F3F9) that respectively gave one and two recombinants. (B) A schematic representation of the OSU1 genomic structure. osu1-3 had an insertion of T-DNA surrounded by its two left border (LB) sequences that eliminated 10 bp starting from the 54th bp of the eighth exon (sequencing data for the T-DNA and genomic DNA junction not shown). The positions of start codon (ATG) and stop codon (TGA) were indicated. (C) Regular RT-PCR analysis of At1g78240 mRNA expression in the three osu1 alleles. PCR reactions with 35 or 39 cycles were used to amplify the 2,055 bp CDS region of At1g78240. ACT2 was used as an internal control. (D) Real-time PCR analysis of At1g78240 transcript levels. A 98 bp fragment of At1g78240 cDNA located in the second exon was amplified. Statistical analysis by one way ANOVA; the asterisk (*) above the column indicates a significant difference (p<0.05) from wild-type (WT). The bar represents the SD of three replicates. (E) osu1-3 fails to complement osu1-1 and osu1-2, respectively. The F1 seeds of the crosses were sown on the medium containing 15C/0.05N and 0.5C/4N, respectively, and two representative seedlings vertically grown for 7 days for each genotype are shown.
Figure 7
Figure 7. Expression patterns of OSU1.
(A) Quantitative RT-PCR analysis of OSU1 under various C/N conditions. WT seedlings were first grown vertically on agar-solidified 15C/4N medium for four days of optimal growth and then transferred to various C/N media for three days. mRNA levels were normalized with those of the ACT2 reference, and the relative OSU1 mRNA level under 0.5C/0.05N was set at 1. The bar represents the SD of three replicates. Statistical analysis by one way ANOVA; the asterisk (*) above the column indicates a significant difference (p<0.05) compared to the control (0.5C/0.05N). (B) RT-PCR analysis of OSU1 expression in different organs. Shown are shoots (Sh) and roots (R) of 7-day-old seedlings, mature leaves (L), stems (St) and flowers (F). ACT2, an internal control. (C-H) Expression patterns revealed by histochemical examination of the OSU1 promoter activity using the GUS reporter. Shown are a 7-day-old young seedling stained for 4 hours (C) and another for 10 hours (D), enlarged views of root hairs (E) and a root tip (F), a mature leaf (G), and an inflorescence with several flowers (H).

References

    1. Coruzzi G, Bush DR. Nitrogen and carbon nutrient and metabolite signaling in plants. Plant Physiol. 2001;125:61–64. - PMC - PubMed
    1. Coruzzi GM, Zhou L. Carbon and nitrogen sensing and signaling in plants: emerging ‘matrix effects’. Curr Opin Plant Biol. 2001;4:247–253. - PubMed
    1. Malamy JE, Ryan KS. Environmental regulation of lateral root initiation in Arabidopsis. Plant Physiol. 2001;127:899–909. - PMC - PubMed
    1. Commichau FM, Forchhammer K, Stulke J. Regulatory links between carbon and nitrogen metabolism. Curr Opin Microbiol. 2006;9:167–172. - PubMed
    1. Marshall S. Role of insulin, adipocyte hormones, and nutrient-sensing pathways in regulating fuel metabolism and energy homeostasis: a nutritional perspective of diabetes, obesity, and cancer. Sci STKE. 2006;2006:re7. - PubMed

Publication types