. 2008 Jan 2;3(1):e1403.
doi: 10.1371/journal.pone.0001403.

Probing host pathogen cross-talk by transcriptional profiling of both Mycobacterium tuberculosis and infected human dendritic cells and macrophages

Affiliations

Probing host pathogen cross-talk by transcriptional profiling of both Mycobacterium tuberculosis and infected human dendritic cells and macrophages

Ludovic Tailleux et al. PLoS One. .

Abstract

Background: Transcriptional profiling using microarrays provides a unique opportunity to decipher host pathogen cross-talk on the global level. Here, for the first time, we have been able to investigate gene expression changes in both Mycobacterium tuberculosis, a major human pathogen, and its human host cells, macrophages and dendritic cells.

Methodology/principal findings: In addition to common responses, we could identify eukaryotic and microbial transcriptional signatures that are specific to the cell type involved in the infection process. In particular M. tuberculosis shows a marked stress response when inside dendritic cells, which is in accordance with the low permissivity of these specialized phagocytes to the tubercle bacillus and to other pathogens. In contrast, the mycobacterial transcriptome inside macrophages reflects that of replicating bacteria. On the host cell side, differential responses to infection in macrophages and dendritic cells were identified in genes involved in oxidative stress, intracellular vesicle trafficking and phagosome acidification.

Conclusions/significance: This study provides the proof of principle that probing the host and the microbe transcriptomes simultaneously is a valuable means to accessing unique information on host pathogen interactions. Our results also underline the extraordinary plasticity of host cell and pathogen responses to infection, and provide a solid framework to further understand the complex mechanisms involved in immunity to M. tuberculosis and in mycobacterial adaptation to different intracellular environments.


Conflict of interest statement

Competing Interests: The authors have declared that no competing interests exist.

Figures

Figure 1
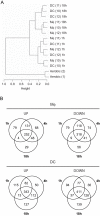
Figure 1. Transcriptional differences between M. tuberculosis-infected Mφs and DCs.
(A) Hierarchical clustering of arrays indicating the donor # (1–9), the time of infection (0, 4, 18, 48 h) and the cell type (Mφs vs DCs). (B) Venn diagrams illustrating the number of up- and down-regulated genes in Mφs (upper panels) and DCs (lower panels) after 4, 18, or 48 h infection, as compared to basal expression levels at the time of infection. (C) Venn diagram showing the number of genes differently modulated in the direct comparison of Mφs and DCs after 4, 18, and 48 h infection.
Figure 2
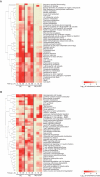
Figure 2. Clustering of functional categories altered in Mφs and DCs upon M. tuberculosis infection.
The 50 top ranking GO (A) and KEGG (B) functional categories according to enrichment p-values of differentially expressed genes in Mφs and DCs at 4, 18 and 48 h post-infection as compared to baseline levels at the time of infection, and in DCs as compared to Mφs at 4, 18 and 48 h post-infection. The order of gene families was determined by hierarchical clustering. Annotation is given according to GO and KEGG nomenclatures. See the online GO and KEGG databases for further details.
Figure 3
Figure 3. Differential regulation of genes involved in oxidative stress, vacuole acidification and intracellular trafficking in M. tuberculosis-infected Mφs and DCs.
Red-blue display showing hierarchical clustering according to normalized expression levels of genes involved in (A) phagocyte oxidase assembly and resistance to oxidative stress, (B) v-ATPase production and phagosome acidification, (C) intracellular trafficking machinery and (D) IFN response and TLR-related pathways. Log2 ratios of absolute expression values divided by the median of each gene across all donors and conditions are reported according to the colour codes indicated.
Figure 4
Figure 4. Validation of candidate genes and phenotypic characterization of M. tuberculosis-infected Mφs and DCs.
(A) Western blotting validation of selected candidate genes Rac1 and Rab9A. Each line contains 5 µg of total proteins. (B) Differential superoxide production expressed in relative light units (RLUs) by Mφs and DCs either treated with PMA (left panel), or infected with M. tuberculosis (right panel). (C) Differential multiplication of M. tuberculosis within human monocyte-derived Mφs and DCs.
Figure 5
Figure 5. Differential mycobacterial response to Mφ and DC infection.
(A) Hierarchical clustering of arrays indicating the donor # (10–12), the time of infection (1, 18 h) and the cell type (Mφs vs DCs). Aerobic indicates log-phase cultivated bacteria in axenic conditions. (B) Venn diagrams illustrating the number of up- and down-regulated mycobacterial genes in Mφs (upper panels) and DCs (lower panels) after 1, 4 and 18 h infection relative to aerobically cultivated bacilli.
Figure 6
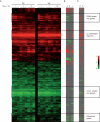
Figure 6. Functional and hierarchical clustering of the M. tuberculosis response to DCs and Mφs infection.
(A) Red-green display showing 1,875 M. tuberculosis genes identified to be significantly differentially expressed at 1, 4 or 18 h in Mφs and DCs relative to aerobic in vitro growth. Genes are ordered in rows, conditions as columns. Red colouring indicates genes induced in intracellular vs. aerobic growth conditions (fold change); green colouring denotes repression. (B) Genes are highlighted that were significantly differentially regulated over time (18 h vs. 1 h) in the M. tuberculosis response to DCs (a) or Mφs (b), red colouring identifies genes induced with time, green repressed; together with (c) those genes identified to be over-expressed (red) or under-expressed (green) after infection of DCs compared to Mφs (DC18h vs. Mφ18h). (C) Genes previously identified in other intracellular studies as being modulated in specific conditions are marked, namely genes induced (red colouring) or repressed (green) inside murine Mφs (d) , and up-regulated (red) or down-regulated (green) in a hollow fibre murine model (e) .
Figure 7
Figure 7. Cell-specific responses of M. tuberculosis to Mφs and DCs.
(A) The transcriptional profiles of 191 genes (red colouring) and 153 genes (green) identified to be significantly over-expressed in DCs and Mφs respectively at 18 h post infection. Box plots showing the gene expression pattern (in fold change) of (B) kstR regulon , (C) dosR regulon , and (D) ribosomal gene family (functional category II.A.1 [63]), in DCs and Mφs at 1, 4 and 18 h timepoints relative to aerobic growth.

References

    1. Ricciardi-Castagnoli P, Granucci F. Opinion: Interpretation of the complexity of innate immune responses by functional genomics. Nat Rev Immunol. 2002;2:881–889. - PubMed
    1. Schnappinger D, Schoolnik GK, Ehrt S. Expression profiling of host pathogen interactions: how Mycobacterium tuberculosis and the macrophage adapt to one another. Microbes Infect. 2006;8:1132–1140. - PubMed
    1. Waddell SJ, Butcher PD. Microarray analysis of whole genome expression of intracellular Mycobacterium tuberculosis. Curr Mol Med. 2007;7:287–296. - PMC - PubMed
    1. Waddell SJ, Butcher PD, Stoker NG. RNA profiling in host-pathogen interactions. Curr Opin Microbiol. 2007;10:297–302. - PMC - PubMed
    1. Russell DG. Mycobacterium tuberculosis: here today, and here tomorrow. Nat Rev Mol Cell Biol. 2001;2:569–577. - PubMed

Publication types

MeSH terms