Association of upper trunk and visceral adipose tissue volume with insulin resistance in control and HIV-infected subjects in the FRAM study
- PMID: 18167644
- PMCID: PMC3164883
- DOI: 10.1097/qai.0b013e31814b94e2
Association of upper trunk and visceral adipose tissue volume with insulin resistance in control and HIV-infected subjects in the FRAM study
Abstract
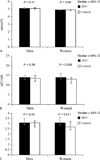
Visceral obesity is associated with insulin resistance, but the association of other regional adipose depots with insulin resistance is not understood. In HIV infection, buffalo hump (upper trunk fat) is associated, but the association of upper trunk fat with insulin resistance has not been examined in controls. To determine the independent association of adipose depots other than visceral with insulin resistance, we performed a cross-sectional analysis of controls and HIV-infected subjects in the Fat Redistribution and Metabolic Change in HIV Infection (FRAM) study, who had measurements of glucose, insulin, and adipose tissue volumes by whole-body magnetic resonance imaging. We studied 926 HIV-positive persons from 16 academic medical center clinics and trials units with demographic characteristics representative of US patients with HIV infection and 258 FRAM controls from the population-based Coronary Artery Risk Development in Young Adults study. We measured visceral adipose tissue (VAT) and subcutaneous adipose tissue (SAT) volume in the legs, arms, lower trunk (back and abdomen), and upper trunk (back and chest) and assessed their association with the homeostasis model of assessment (HOMA) and HOMA >4 by stepwise multivariable analysis. The prevalence of HOMA >4 as a marker of insulin resistance was 28% among controls compared with 37% among HIV-infected subjects (P = 0.005). Among controls, those in the highest tertile of upper trunk SAT volume had an odds ratio (OR) of 9.0 (95% confidence interval [CI]: 2.4 to 34; P = 0.001) for having HOMA >4 compared with the lowest tertile, whereas in HIV-positive subjects, the OR was lower (OR = 2.09, 95% CI: 1.36 to 3.19; P = 0.001). Among controls, the highest tertile of VAT volume had an OR of 12.1 (95% CI: 3.2 to 46; P = 0.0002) of having HOMA >4 compared with the lowest tertile, whereas in HIV-positive subjects, the OR was 3.12 (95% CI: 2.0 to 4.8; P < 0.0001). After adjusting for VAT and upper trunk SAT, the association of other SAT depots with HOMA >4 did not reach statistical significance. Thus, VAT and upper trunk SAT are independently associated with insulin resistance in controls and in HIV-infected persons.
Trial registration: ClinicalTrials.gov NCT00331448.
Figures


References
-
- Evans DJ, Hoffmann RG, Kalkhoff RK, et al. Relationship of body fat topography to insulin sensitivity and metabolic profiles in premenopausal women. Metabolism. 1984;33:68–75. - PubMed
-
- Despres JP. Health consequences of visceral obesity. Ann Med. 2001;33:534–541. - PubMed
-
- Haffner SM, Fong D, Hazuda HP, et al. Hyperinsulinemia, upper body adiposity, and cardiovascular risk factors in non-diabetics. Metabolism. 1988;37:338–345. - PubMed
Publication types
MeSH terms
Associated data
Grants and funding
- M01-RR00083/RR/NCRR NIH HHS/United States
- HL74814/HL/NHLBI NIH HHS/United States
- M01 RR000865/RR/NCRR NIH HHS/United States
- M01 RR000054/RR/NCRR NIH HHS/United States
- M01-RR00052/RR/NCRR NIH HHS/United States
- M01 RR000052/RR/NCRR NIH HHS/United States
- R01 HL074814/HL/NHLBI NIH HHS/United States
- M01-RR00865/RR/NCRR NIH HHS/United States
- M01-RR0636/RR/NCRR NIH HHS/United States
- R01-DK57508/DK/NIDDK NIH HHS/United States
- R01 DK057508/DK/NIDDK NIH HHS/United States
- M01 RR000036/RR/NCRR NIH HHS/United States
- HL 53359/HL/NHLBI NIH HHS/United States
- M01 RR000051/RR/NCRR NIH HHS/United States
- M01-RR00051/RR/NCRR NIH HHS/United States
- M01-RR00036/RR/NCRR NIH HHS/United States
- M01-RR00054/RR/NCRR NIH HHS/United States
- M01 RR000083/RR/NCRR NIH HHS/United States
LinkOut - more resources
Full Text Sources
Medical
Molecular Biology Databases
Research Materials

