. 2008 Jan 24;112(3):938-46.
doi: 10.1021/jp0764384. Epub 2008 Jan 3.

Treating entropy and conformational changes in implicit solvent simulations of small molecules

Affiliations

Treating entropy and conformational changes in implicit solvent simulations of small molecules

David L Mobley et al. J Phys Chem B. .

Abstract

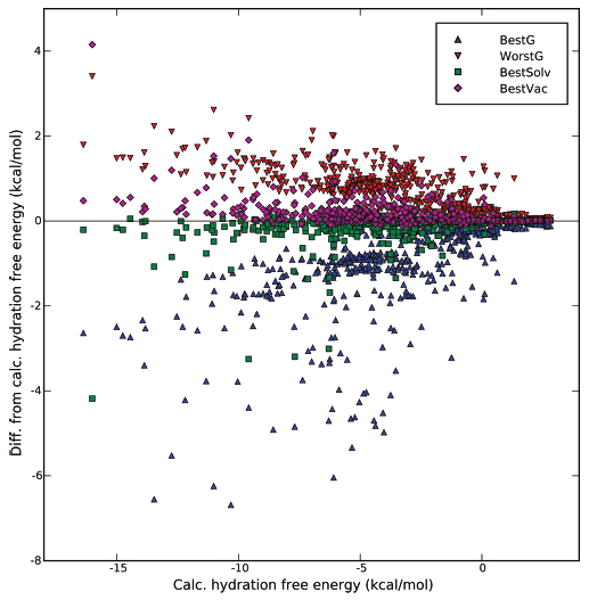
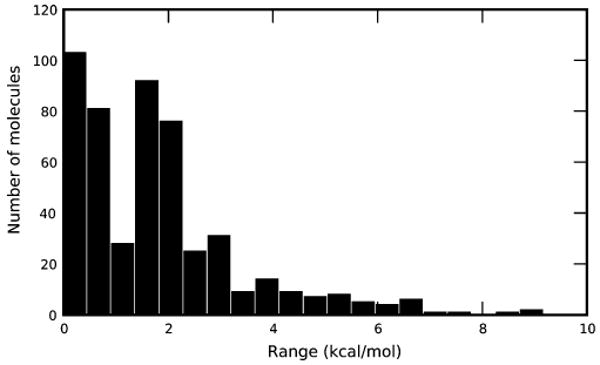
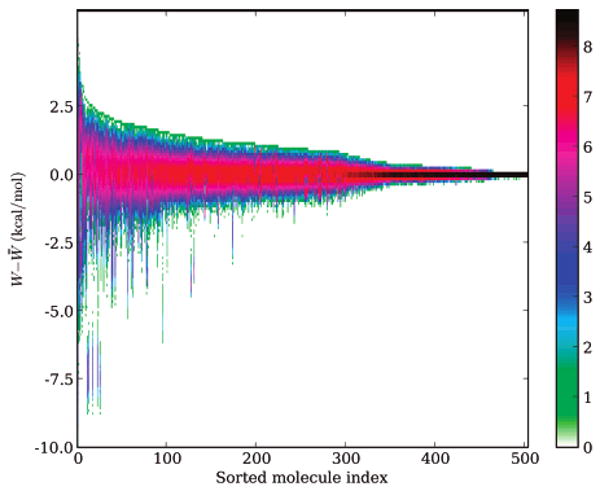
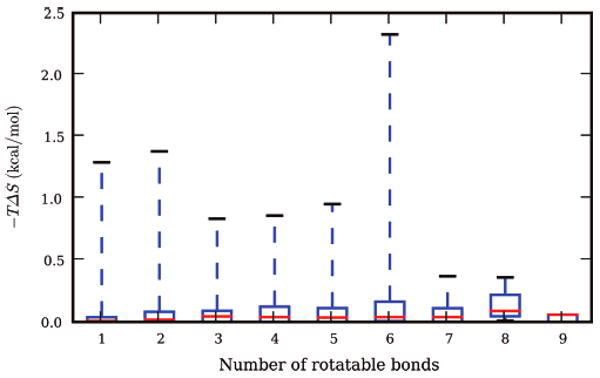
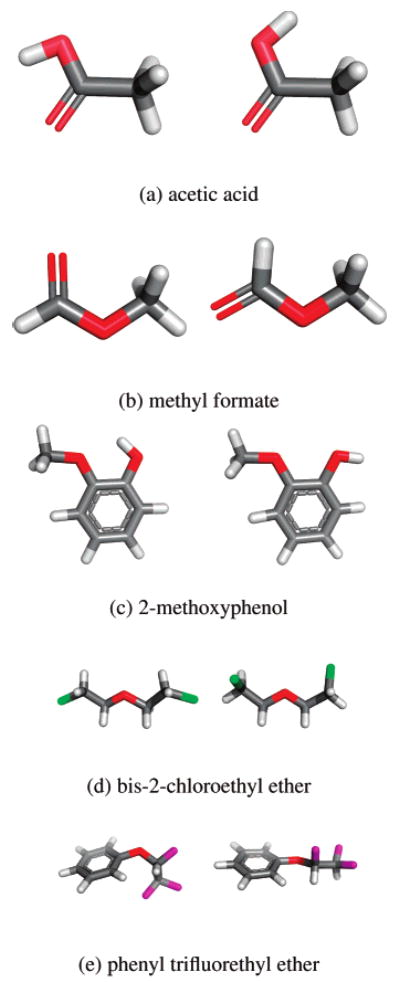
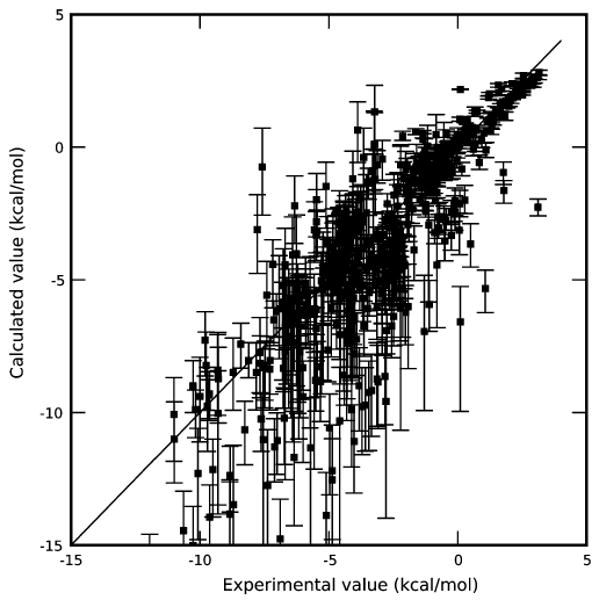
Implicit solvent models are increasingly popular for estimating aqueous solvation (hydration) free energies in molecular simulations and other applications. In many cases, parameters for these models are derived to reproduce experimental values for small molecule hydration free energies. Often, these hydration free energies are computed for a single solute conformation, neglecting solute conformational changes upon solvation. Here, we incorporate these effects using alchemical free energy methods. We find significant errors when hydration free energies are estimated using only a single solute conformation, even for relatively small, simple, rigid solutes. For example, we find conformational entropy (TDeltaS) changes of up to 2.3 kcal/mol upon hydration. Interestingly, these changes in conformational entropy correlate poorly (R2 = 0.03) with the number of rotatable bonds. The present study illustrates that implicit solvent modeling can be improved by eliminating the approximation that solutes are rigid.


Figures

Figure 1
Figure 1
Calculated hydration free energies, versus error with single-conformation schemes. Calculated hydration free energies are plotted, versus the error from these values when using different choices of single-conformations for computing hydration free energies. The different schemes are as follows: BestG, the conformation resulting in the most favorable hydration free energy estimate; WorstG, the conformation resulting in the least favorable hydration free energy estimate; BestVac, the conformation with the lowest potential energy in vacuum; and BestSolv, the conformation with the lowest potential energy in solvent. The γ = 0 line indicates exact agreement between calculated single-conformation hydration free energies and calculated hydration free energies. Values below the line overestimate the affinity for water; those above the line underestimate the affinity for water.
Figure 2
Figure 2
Distribution of range of single-conformation hydration free energies. Single-conformation hydration free energies are sensitive to the choice of conformation used. For each compound, the range is the difference between the minimum and maximum single-conformation hydration free energies obtained. Shown here is a histogram of the ranges for the 504 small molecules in the test set.
Figure 3
Figure 3
Distribution of single-conformation hydration free energies. Shown on the vertical axis is the distribution of single-conformation hydration free energies around the mean for each molecule; W denotes the single-conformation hydration free energy, and W̄) is the mean single-conformation hydration free energy. Colors denote the natural log of the binned probability of each energy. Molecules are sorted by the width of their single-conformation hydration free energy distributions.
Figure 4
Figure 4
Number of rotatable bonds versus –TΔS of solvation. Shown is a box plot of the number of rotatable bonds versus –TΔS of solvation. The red line shows the median; the box shows the bounds of the upper and lower quartiles, and the dashed lines show the full range of –TΔS. The correlation between –TΔS and the number of rotatable bonds is only R2 = 0.03, and there are 17 small molecules with –TΔS larger than 0.5 kcal/mol.
Figure 5
Figure 5
Sample conformations for molecules with significant ranges in computed hydration free energies. For each molecule, the left shows the lowest potential energy conformation in vacuum (BestVac) scheme from one simulation. (a) The BestVac conformation (left) yields a single-conformation hydration free energy of −8.95 kcal/mol; the BestSolv conformation (right) yields −17.75 kcal/mol. Worst and BestG conformations are similar to these two, respectively. (b) The BestVac conformation (left) yields −9.72 kcal/mol; the BestSolv conformation (right) yields −14.83 kcal/mol. WorstG and BestG conformations are similar to these two, respectively. (c) The BestVac conformation (left) yields −8.33 kcal/mol; the BestG conformation (right) yields −14.73 kcal/mol. BestSolv and WorstG conformations are similar to BestVac. (d) The BestVac conformation (left) yields −8.84 kcal/mol; the BestSolv conformation (right) yields −11.38 kcal/mol. WorstG and BestG conformations are similar to these two, respectively. (e) The BestVac conformation (left) yields −8.67 kcal/mol and the BestSolv conformation (right) yields −11.38 kcal/mol. The WorstG and BestG conformations are similar to these two, respectively. Images were made with PyMOL.
Figure 6
Figure 6
Computed hydration free energies, and range of single-conformation interaction energies, versus experiment. Computed hydration free energies are shown as black squares; vertical bars denote the range of single-conformation hydration free energies possible depending on the choice of solute conformation. The diagonal line is the x = y line.

References

    1. Shoichet BK, Leach AR, Kuntz ID. Proteins Struct Funct Genet. 1999;34:4–16. - PubMed
    1. Kalyanaraman C, Bernacki K, Jacobson MP. Biochemistry. 2005;44:2059–2071. - PubMed
    1. Camacho CJ, Ma H, Champ PC. Proteins Struct Funct Bioinf. 2006;63:868–877. - PubMed
    1. Ferrara P, Gohlke H, Price DJ, Klebe G, Brooks CL., III J Med Chem. 2004;47:3032–3047. - PubMed
    1. Huang N, Kalyanaraman C, Jacobson MPJ. Chem Inf Model. 2006;46:243–253. - PubMed

Publication types