Relationship between T cell activation and CD4+ T cell count in HIV-seropositive individuals with undetectable plasma HIV RNA levels in the absence of therapy
- PMID: 18171295
- PMCID: PMC3466592
- DOI: 10.1086/524143
Relationship between T cell activation and CD4+ T cell count in HIV-seropositive individuals with undetectable plasma HIV RNA levels in the absence of therapy
Abstract
Background: Although untreated human immunodeficiency virus (HIV)-infected patients maintaining undetectable plasma HIV RNA levels (elite controllers) have high HIV-specific immune responses, it is unclear whether they experience abnormal levels of T cell activation, potentially contributing to immunodeficiency.
Methods: We compared percentages of activated (CD38(+)HLA-DR(+)) T cells between 30 elite controllers, 47 HIV-uninfected individuals, 187 HIV-infected individuals with undetectable viremia receiving antiretroviral therapy (antiretroviral therapy suppressed), and 66 untreated HIV-infected individuals with detectable viremia. Because mucosal translocation of bacterial products may contribute to T cell activation in HIV infection, we also measured plasma lipopolysaccharide (LPS) levels.
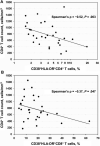
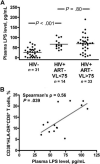
Results: Although the median CD4(+) cell count in controllers was 727 cells/mm(3), 3 (10%) had CD4(+) cell counts <350 cells/mm(3) and 2 (7%) had acquired immunodeficiency syndrome. Controllers had higher CD4(+) and CD8(+) cell activation levels (P < .001 for both) than HIV-negative subjects and higher CD8(+) cell activation levels than the antiretroviral therapy suppressed (P = .048). In controllers, higher CD4(+) and CD8(+) T cell activation was associated with lower CD4(+) cell counts (P = .009 and P = .047). Controllers had higher LPS levels than HIV-negative subjects (P < .001), and in controllers higher LPS level was associated with higher CD8(+) T cell activation (P = .039).
Conclusion: HIV controllers have abnormally high T cell activation levels, which may contribute to progressive CD4(+) T cell loss even without measurable viremia.
Figures


References
-
- Hubert JB, Burgard M, Dussaix E, et al. Natural history of serum HIV-1 RNA levels in 330 patients with a known date of infection. The SEROCO Study Group. AIDS. 2000;14:123–31. - PubMed
-
- Goudsmit J, Bogaards JA, Jurriaans S, et al. Naturally HIV-1 seroconverters with lowest viral load have best prognosis, but in time lose control of viraemia. AIDS. 2002;16:791–3. - PubMed
-
- Lambotte O, Boufassa F, Madec Y, et al. HIV controllers: a homogeneous group of HIV-1–infected patients with spontaneous control of viral replication. Clin Infect Dis. 2005;41:1053–6. - PubMed
-
- Madec Y, Boufassa F, Porter K, Meyer L. Spontaneous control of viral load and CD4 cell count progression among HIV-1 seroconverters. AIDS. 2005;19:2001–7. - PubMed
Publication types
MeSH terms
Substances
Grants and funding
- P30 MH062246/MH/NIMH NIH HHS/United States
- NS 37660/NS/NINDS NIH HHS/United States
- R01 NS037660/NS/NINDS NIH HHS/United States
- K23 AI65244/AI/NIAID NIH HHS/United States
- R01 AI052745/AI/NIAID NIH HHS/United States
- K23 AI065244/AI/NIAID NIH HHS/United States
- DP1 OD000329/OD/NIH HHS/United States
- P30 MH59037/MH/NIMH NIH HHS/United States
- 5-MO1-RR00083-37/RR/NCRR NIH HHS/United States
- P30 AI027763/AI/NIAID NIH HHS/United States
- DPI OD00329/OD/NIH HHS/United States
- R37 AI040312/AI/NIAID NIH HHS/United States
- M01 RR000083/RR/NCRR NIH HHS/United States
- R01 AI 52745/AI/NIAID NIH HHS/United States
- P30 MH62246/MH/NIMH NIH HHS/United States
- P30 AI27763/AI/NIAID NIH HHS/United States
- R37 AI40312/AI/NIAID NIH HHS/United States
LinkOut - more resources
Full Text Sources
Other Literature Sources
Medical
Research Materials

