

doi: 10.1186/gb-2008-9-1-r2.
High-resolution analysis of condition-specific regulatory modules in Saccharomyces cerevisiae
Affiliations
- PMID: 18171483
- PMCID: PMC2395236
- DOI: 10.1186/gb-2008-9-1-r2
Item in Clipboard
High-resolution analysis of condition-specific regulatory modules in Saccharomyces cerevisiae
Genome Biol.
.
Abstract
We present an approach for identifying condition-specific regulatory modules by using separate units of gene expression profiles along with ChIP-chip and motif data from Saccharomyces cerevisiae. By investigating the unique and common features of the obtained condition-specific modules, we detected several important properties of transcriptional network reorganization. Our approach reveals the functionally distinct coregulated submodules embedded in a coexpressed gene module and provides an effective method for identifying various condition-specific regulatory events at high resolution.
Figures

Overview of the method. (a) Splitting the genome-wide location (ChIP-chip) data into several coexpressed gene sets. Each of the derived target gene sets was called an IMC. Each IMC was named after the transcription factor of the ChIP-chip data followed by a serial number. Gray rectangles indicate the IMCs. Small dots indicate the genes bound to the transcription factor. (b) Generation of preEPMs. The IMCs with similar mean expression patterns were grouped for further analysis. (c) Detecting the regulators in each IMC. Initially, the over-represented motifs in each IMC were detected by the t-test. Next, biologically significant motif evidence and ChIP-chip evidence were selected using a test based on the hypergeometric distribution. Subsequently, in the case of motif evidence, recurrently confirmed motifs in each preEPM were selected. Yellow diamonds and ellipses indicate biologically significant regulators. Gray diamonds and ellipses represent the regulators that were not qualified by the test. Gray curved lines between the regulators indicate synergistic pairs. (d) Identification of an EPM. For each preEPM, the IMCs without a confirmed regulator were eliminated, and the retained IMCs and their corresponding regulators were arranged. Solid lines indicate motif evidence, and dotted lines indicate ChIP-chip evidence. (e) Identification of an RM. Regulators with highly overlapped target genes were united to identify an RM.
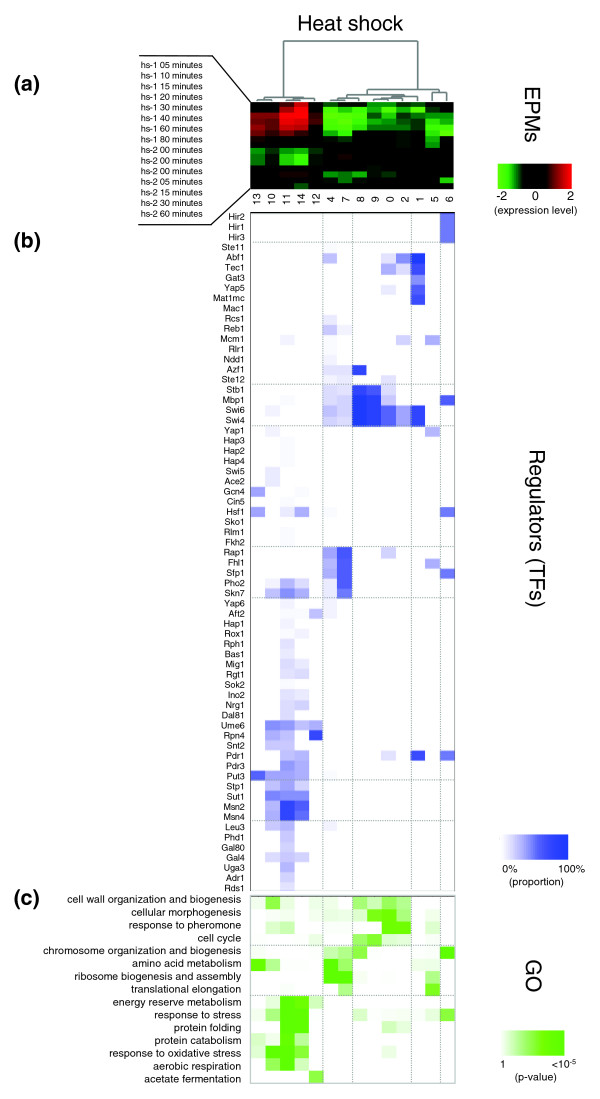
EPMs identified in the heat shock condition. (a) The result by hierarchical clustering of the average expression patterns of EPMs in the heat shock condition. The numbers indicate the EPM indices. (b) Regulator matrix whose entries represent the percentage of genes controlled by each transcription factor in the EPM. The names of transcription factors are shown on the left side. (c) Gene annotation enrichment matrix whose entries represent the enrichment levels of each EPM in the GO 'biological process' categories shown on the left side. For efficient explanation and visualization, only selected GO categories are shown. EPMs identified in the nitrogen depletion and the cell cycle conditions are shown in Additional data file 2.
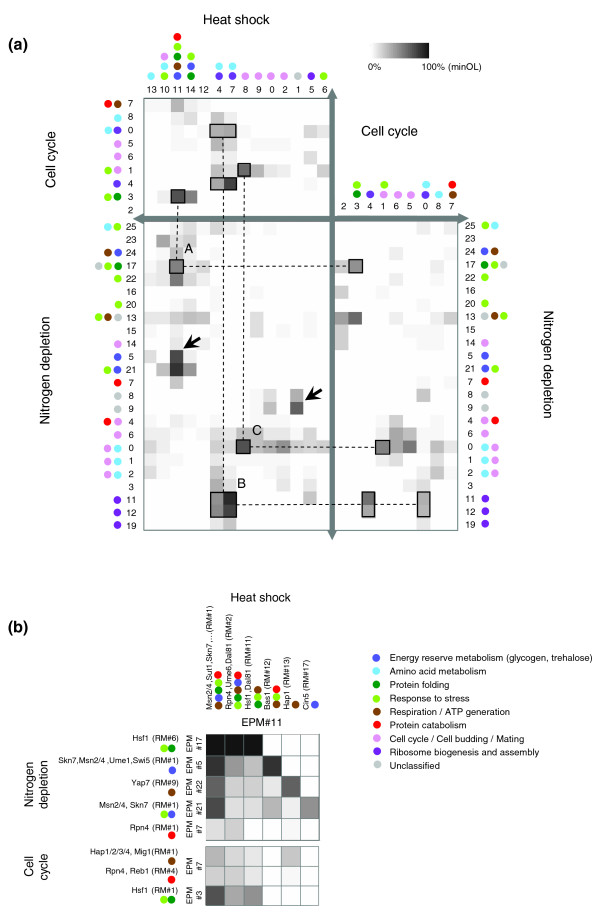
Overlap matrices of regulatory modules. (a) Overlap matrices between EPMs in all the three conditions. The OLs were calculated as the proportion of the intersection genes in the smaller EPM (minOL). The enriched GO categories of each EPM are also shown as several colored dots. Black-lined boxes represent the EPMs that are significantly overlapped across all the three conditions. 'A' indicates the overlapped stress-related EPMs represented by the three boxes linked by dashed lines. They have the common regulators Msn2/4 and Hsf1. Identically, the EPMs indicated as 'B' have the common regulators Rap1, Sfp1 and Fhl1. The EPMs indicated as 'C' have Mbp1, Swi4, Swi6 and Stb1 as their common regulators. Black arrows indicate EPMs that are highly overlapped between the heat shock and nitrogen depletion conditions. (b) Overlap matrices between RMs (minOL). Several RMs, which were included in the distinct EPMs in the nitrogen depletion and cell cycle conditions, are significantly overlapped with the RMs in heat shock EPM 11.
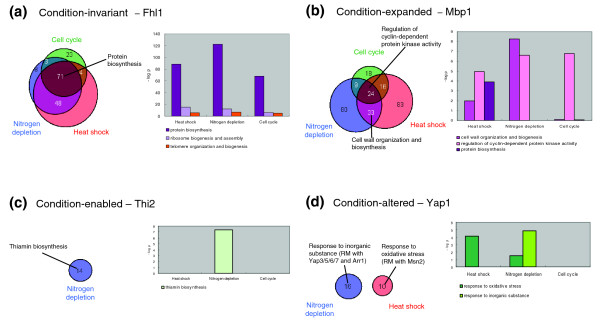
Condition-specific types of transcription factor. The transcription factors were classified into four types based on the alteration in the target genes: (a) condition-invariant, (b) condition-expanded, (c) condition-enabled and (d) condition-altered. The venn diagrams show the overlapped target genes of the representative transcription factors among the three conditions. In the bar graph, the y-axis represents the significance of the p value for the enriched functional categories of the target genes in each condition.
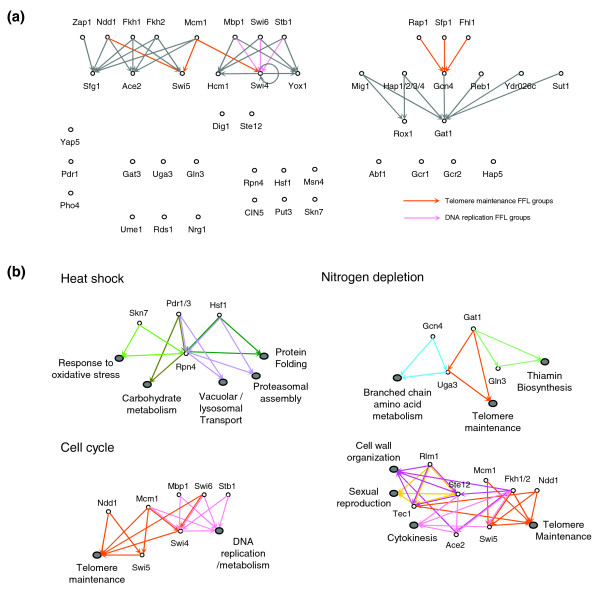
Transcriptional regulation among transcription factors. (a) Regulatory network among the transcription factors in the cell cycle condition. Each arrow represents transcriptional regulation. Two transcription factors linked by each colored arrow form an FFL group with the genes that are enriched in some specific functional category. The colors of the arrows imply the enriched functional categories. The networks in the two stress conditions are shown in Additional data file 9. (b) Condition-specific FFL groups. Each gray ellipse represents the overlapped target genes of the two transcription factors in an FFL group. Only selected FFL groups are shown (see Additional data file 10 for the complete list of the enriched functional categories of the FFL groups).
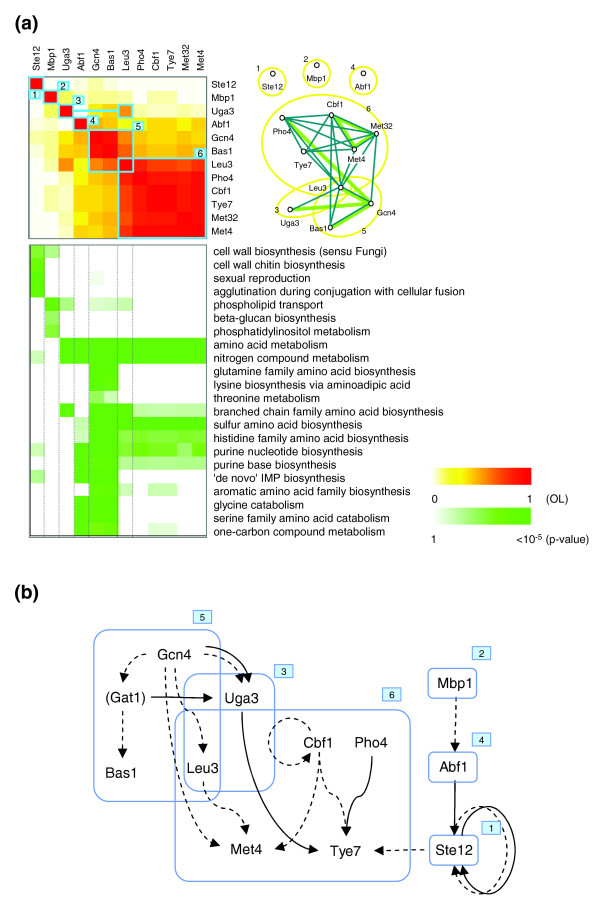
Case study: RMs in nitrogen depletion EPM 2. (a) EPM 2 of the nitrogen depletion condition is represented by two matrices. The upper matrix represents the overlap between the target genes of the regulators in the EPM, and blue boxes represent the RMs. The lower matrix represents the enrichment of the target genes per regulator in the GO 'biological process' categories. For simplicity, only selected categories are shown. A more detailed explanation is presented in Additional data file 4, and the complete matrices with all significantly enriched categories (p value < 0.01) are presented in Additional data file 11. In the graph, yellow ellipses indicate the RMs. Blue lines represent a significant overlap (OL ≥ 0.5) between the target genes of the two transcription factors at nodes, and green lines represent synergistic links identified by the hypergeometric test for transcription factor pairs (see Materials and methods). The detailed information about other EPMs and RMs is available in Additional data file 11. (b) Potential regulatory scheme among the regulators in the nitrogen depletion EPM 2. Solid arrows indicate the regulator-target gene relationship from the prediction under the nitrogen depletion condition, and dotted arrows indicate the transcription factor binding information from ChIP-chip data. Gat1 is included for completion of the hierarchy, although it is not among the predicted regulators of the nitrogen depletion EPM 2.
References
Publication types
MeSH terms
LinkOut - more resources
Full Text Sources
Molecular Biology Databases
