. 2008 Mar;294(3):E558-67.
doi: 10.1152/ajpendo.00167.2007. Epub 2008 Jan 2.

HIV-protease inhibitors induce expression of suppressor of cytokine signaling-1 in insulin-sensitive tissues and promote insulin resistance and type 2 diabetes mellitus

Affiliations

HIV-protease inhibitors induce expression of suppressor of cytokine signaling-1 in insulin-sensitive tissues and promote insulin resistance and type 2 diabetes mellitus

Michael J Carper et al. Am J Physiol Endocrinol Metab. 2008 Mar.

Abstract

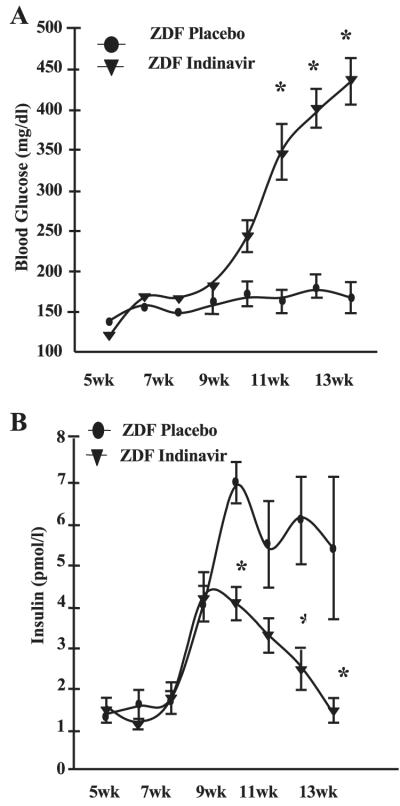
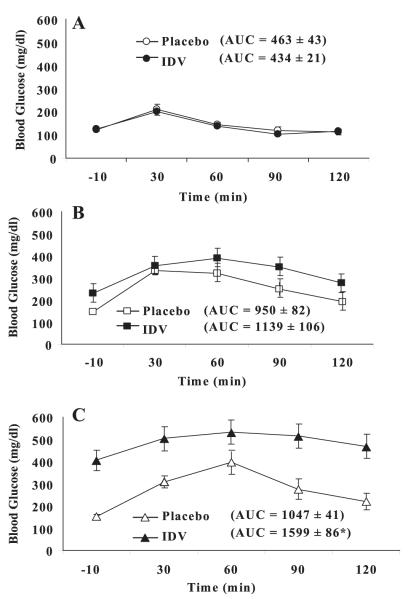
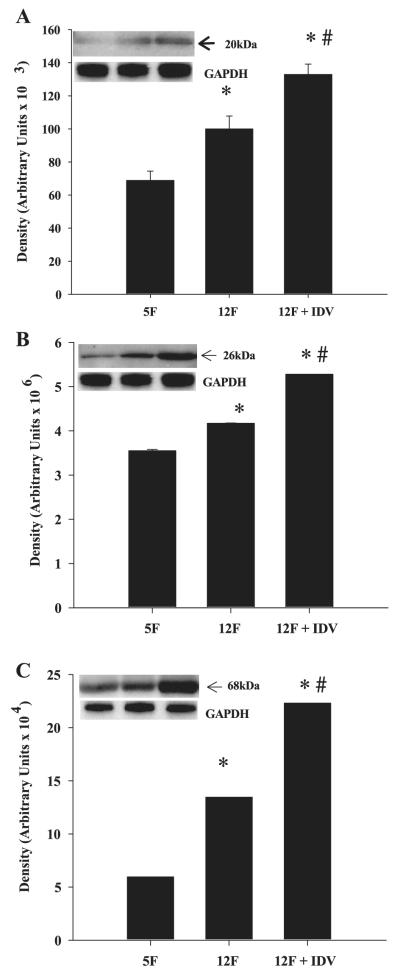
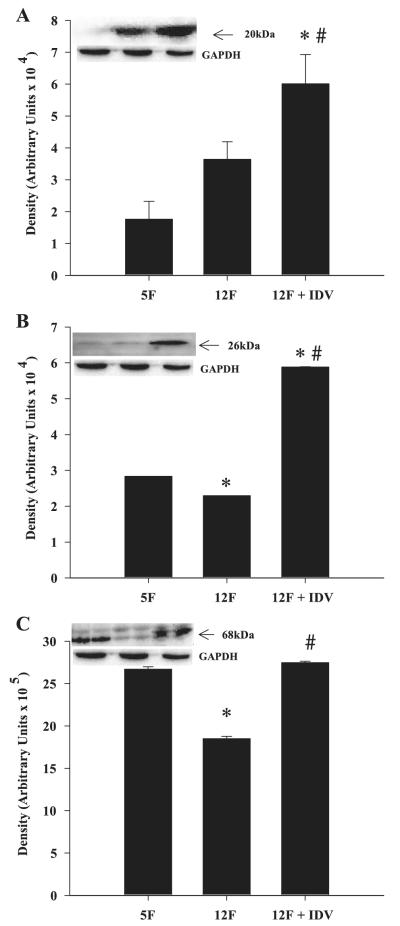
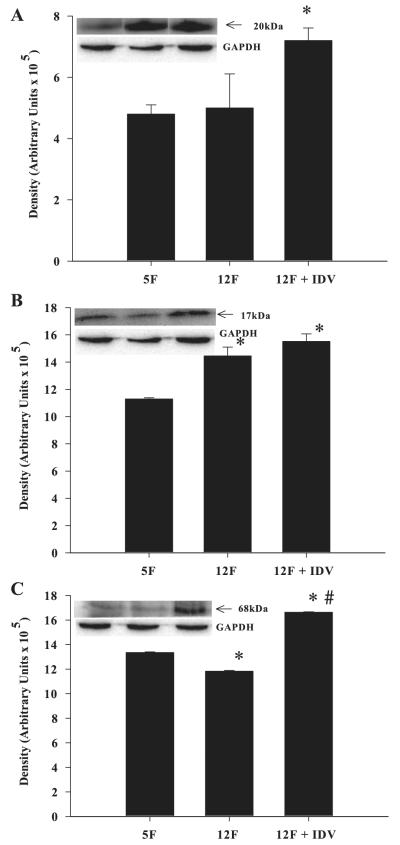
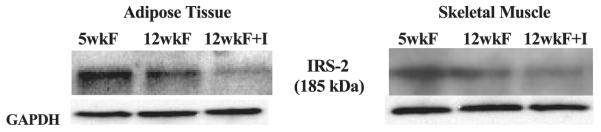
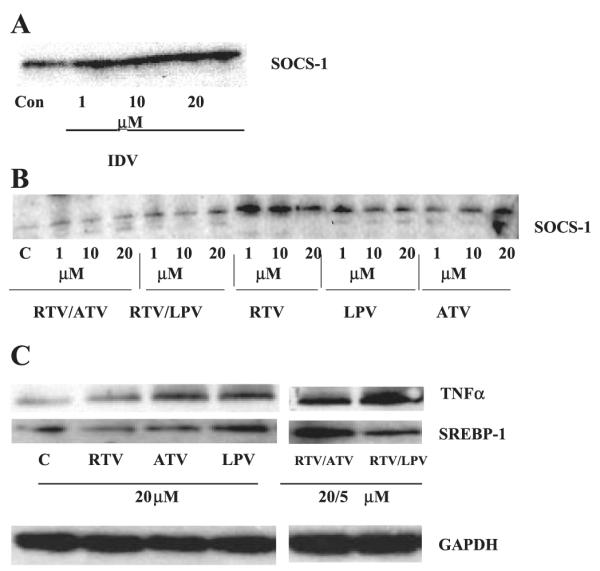
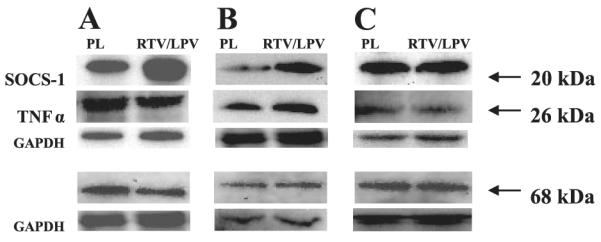
Insulin resistance, hyperglycemia, and type 2 diabetes are among the sequelae of metabolic syndromes that occur in 60-80% of human immunodeficiency virus (HIV)-positive patients treated with HIV-protease inhibitors (PIs). Studies to elucidate the molecular mechanism(s) contributing to these changes, however, have mainly focused on acute, in vitro actions of PIs. Here, we examined the chronic (7 wk) in vivo effects of the PI indinavir (IDV) in male Zucker diabetic fatty (fa/fa) (ZDF) rats. IDV exposure accelerated the diabetic state and dramatically exacerbated hyperglycemia and oral glucose intolerance in the ZDF rats, compared with vehicle-treated ZDF rats. Oligonucleotide gene array analyses revealed upregulation of suppressor of cytokine signaling-1 (SOCS-1) expression in insulin-sensitive tissues of IDV rats. SOCS-1 is a known inducer of insulin resistance and diabetes, and immunoblotting analyses revealed increases in SOCS-1 protein expression in adipose, skeletal muscle, and liver tissues of IDV-administered ZDF rats. This was associated with increases in the upstream regulator TNF-alpha and downstream effector sterol regulatory element-binding protein-1 and a decrease in IRS-2. IDV and other PIs currently in clinical use induced the SOCS-1 signaling cascade also in L6 myotubes and 3T3-L1 adipocytes exposed acutely to PIs under normal culturing conditions and in tissues from Zucker wild-type lean control rats administered PIs for 3 wk, suggesting an effect of these drugs even in the absence of background hyperglycemia/hyperlipidemia. Our findings therefore indicate that induction of the SOCS-1 signaling cascade by PIs could be an important contributing factor in the development of metabolic dysregulation associated with long-term exposures to HIV-PIs.


Figures

Fig. 1
Fig. 1
Whole body composition in Zucker wild-type lean (ZWT) and Zucker diabetic fatty (fa/fa) (ZDF) rats. Body weight (A), %lean (B), and %fat (C) mass were assessed by dual-energy X-ray absorptiometry scanning in ZWT rats at 5 (5L) and 12 (12L) wk of age, in ZDF rats at 5 wk (5F) of age, and in ZDF rats at 12 wk of age after administration of either placebo (12F) or indinavir (IDV; 12F + IDV) for 7 wk. Results are mean ± SE (n = 8 in each group). *P ≤ 0.05, 5F group significantly different from 5L group. #P ≤ 0.05, 12F and 12F + IDV groups significantly different from other groups.
Fig. 2
Fig. 2
Effects of IDV on plasma glucose and triglyceride levels in ZDF rats. Blood was collected from ZDF rats before administration of placebo or IDV and at the end of the study period for glucose (A) and triglycerides (B) measurements. Results are mean ± SE (n = 8 in each group). *P ≤ 0.05, 12-wk groups significantly different from 5-wk groups. #P ≤ 0.01 (A) and P ≤ 0.05 (B), 12-wk placebo group significantly different from 12-wk IDV groups.
Fig. 3
Fig. 3
IDV exacerbates hyperglycemia in ZDF rats. Blood was collected at weekly intervals from ZDF rats before and during administration of placebo and for glucose (A) and insulin (B) measurements. Results are mean ± SE (n = 8 in each group). *P ≤ 0.05, IDV groups significantly different from placebo group.
Fig. 4
Fig. 4
IDV impairs glucose tolerance in ZDF rats. Oral glucose tolerance tests were performed in overnight-fasted ZDF rats before and after 4 and 7 wk administration of placebo or IDV; day 0 (A), 4 wk (B), and 7 wk (C). Results are mean ± SE (n = 4 in each group). *P ≤ 0.05, IDV groups significantly different from placebo group.
Fig. 5
Fig. 5
Suppressor of cytokine signaling-1 (SOCS-1), TNF-α, and sterol regulatory element-binding protein-1 (SREBP-1) expression in adipose tissue of placebo- and IDV-administered ZDF fa/fa rats. Adipose tissue homogenates were prepared from ZDF rats after placebo or IDV administration for 7 wk and processed for immunoblotting analyses of SOCS-1 (A), TNF-α (B), and SREBP-1 (C). AC: quantified data; each bar is mean ± SE (n = 4 in each group) of the respective protein. Insets: representative immunoblots for each protein and corresponding GAPDH control. *P ≤ 0.05, significantly different from 5F group. #P ≤ 0.05, significantly different from 12F group.
Fig. 6
Fig. 6
SOCS-1, TNF-α, and SREBP-1 expression in skeletal muscle of placebo- and IDV-administered ZDF fa/fa rats. Skeletal muscle homogenates were prepared from ZDF rats after placebo or IDV administration for 7 wk and processed for immunoblotting analyses of SOCS-1 (A), TNF-α (B), and SREBP-1 (C). AC: quantified data; each bar is mean ± SE (n = 4 in each group) of the respective protein. Insets: representative immunoblots for each protein and corresponding GAPDH control. *P ≤ 0.05, significantly different from 5F group. #P ≤ 0.05, significantly different from 12F group.
Fig. 7
Fig. 7
SOCS-1, TNF-α, and SREBP-1 expression in liver tissue of placebo- and IDV-administered ZDF rats. Liver tissue homogenates were prepared from ZDF rats after placebo or IDV administration for 7 wk and processed for immunoblotting analyses of SOCS-1 (A), TNF-α (B), and SREBP-1 (C). AC: quantified data; each bar is mean ± SE (n = 4 in each group) of the respective protein. Insets: representative immunoblots for each protein and corresponding GAPDH control. *P ≤ 0.05, significantly different from 5F group. #P ≤ 0.05, significantly different from 12F group.
Fig. 8
Fig. 8
IRS-2 expression in adipose tissue and skeletal muscle of placebo- and IDV-adminstered ZDF rats. Adipose tissue and skeletal muscle homogenates were prepared from ZDF rats after placebo or IDV administration for 7 wk and processed for immunoblotting analyses of IRS-2. Shown are 5F (n = 5), 12F (n = 5), and 12F + I (n = 5) placebo- and IDV-administered ZDF rats. Corresponding GAPDH control bands in each tissue are shown below.
Fig. 9
Fig. 9
SOCS-1, TNF-α, and SREBP-1 expression in L6 myotubes and 3T3-L1 adipocytes exposed to HIV-protease inhibitors. A: 3T3-L1 adipocytes were exposed to IDV for 1, 15, and 24 h at 37°C and 10% CO2-90% O2. B: L6 myotubes were exposed to 1, 10, and 20 μmol/l RTV/ATV, RTV/LPV, RTV, LPV, and ATV at 37°C, 5% CO2-95% O2 for 3 h. C: L6 myotubes were exposed to protease inhibitors alone (RTV, ATV, and LPV; 20 μM) or incombination (RTV/ATV, RTV/LPV; 20 μM ATV and LPV; 5 μM RTV). IDV, indinavir; RTV, ritonavir; LPV, lopinavir; ATV, atazanavir. Each lane represents the combination of 3 wells from a 12-well culture plate. Corresponding GAPDH control bands are shown below.
Fig. 10
Fig. 10
SOCS-1, TNF-α, and SREBP-1 expression in adipose tissue, skeletal muscle, and liver tissue of placebo and RTV/LPV-administered control ZWT lean rats. Adipose tissue (A), skeletal muscle (B), and liver (C) homogenates were prepared from ZWT lean rats after placebo or RTV/LPV administration and processed for immunoblotting analyses. AC: ZWT lean rats administered placebo (n = 3) and RTV/LPV (n = 5). Corresponding GAPDH control bands in each tissue are shown below.

Similar articles

Cited by

References

    1. Abel ED, Peroni O, Kim JK, Kim YB, Boss O, Hadro E, Minnemann T, Shulman GI, Kahn BB. Adipose-selective targeting of the GLUT4 gene impairs insulin action in muscle and liver. Nature. 2001;409:729–733. - PubMed
    1. Alexander WS, Hilton DJ. The role of suppressors of cytokine signaling (SOCS) proteins in regulation of the immune response. Annu Rev Immunol. 2004;22:503–529. - PubMed
    1. Almind K, Doria A, Kahn CR. Putting the genes for type II diabetes on the map. Nat Med. 2001;7:277–279. - PubMed
    1. Autran B, Carcelain G, Li TS, Blanc C, Mathez D, Tubiana R, Katlama C, Debre P, Leibowitch J. Positive effects of combined anti-retroviral therapy on CD4+ T cell homeostasis and function in advanced HIV disease. Science. 1997;277:112–116. - PubMed
    1. Bastard JP, Maachi M, Lagathu C, Kim MJ, Caron M, Vidal H, Capeau J, Feve B. Recent advances in the relationship between obesity, inflammation, and insulin resistance. Eur Cytokine Netw. 2006;17:4–12. - PubMed

Publication types

MeSH terms