. 2008 Jan 2;28(1):39-49.
doi: 10.1523/JNEUROSCI.2196-07.2008.

Lrig1 is an endogenous inhibitor of Ret receptor tyrosine kinase activation, downstream signaling, and biological responses to GDNF

Affiliations

Lrig1 is an endogenous inhibitor of Ret receptor tyrosine kinase activation, downstream signaling, and biological responses to GDNF

Fernanda Ledda et al. J Neurosci. .

Abstract

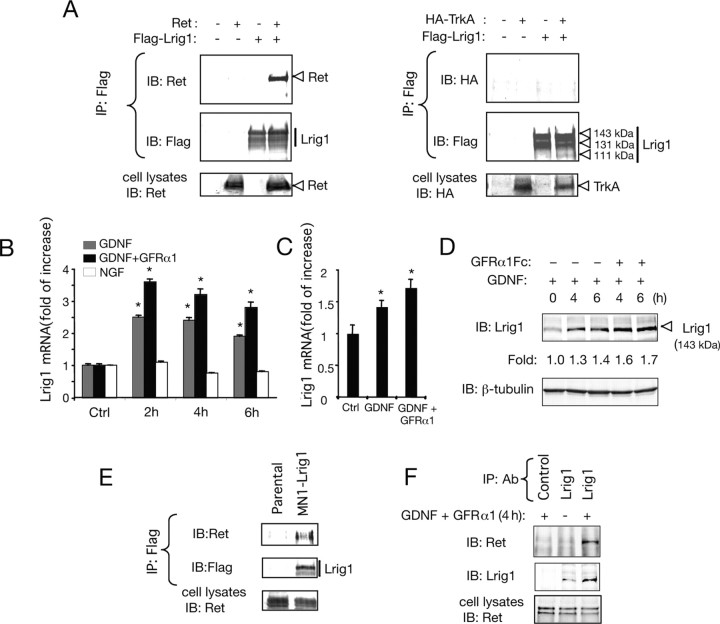
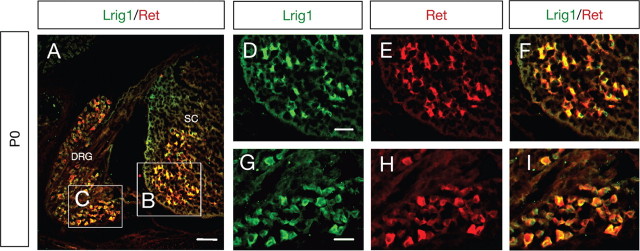
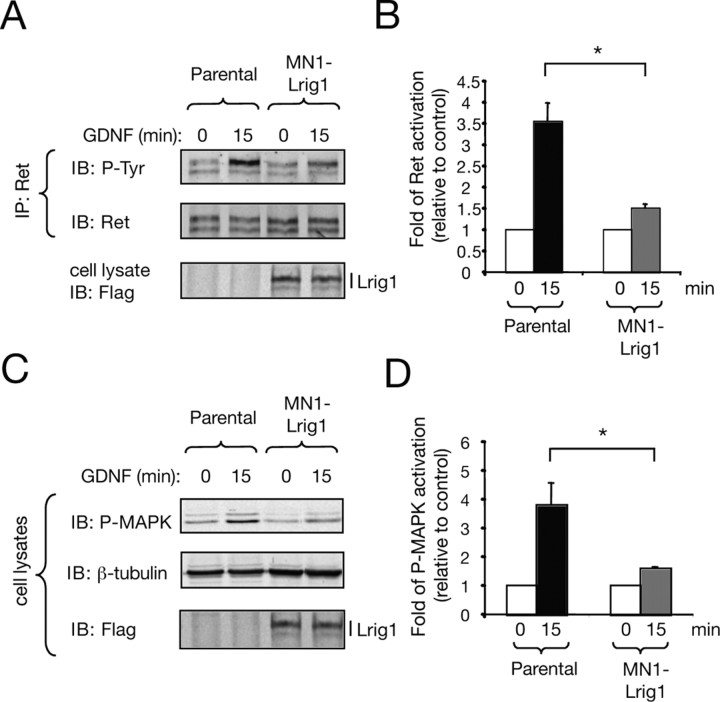
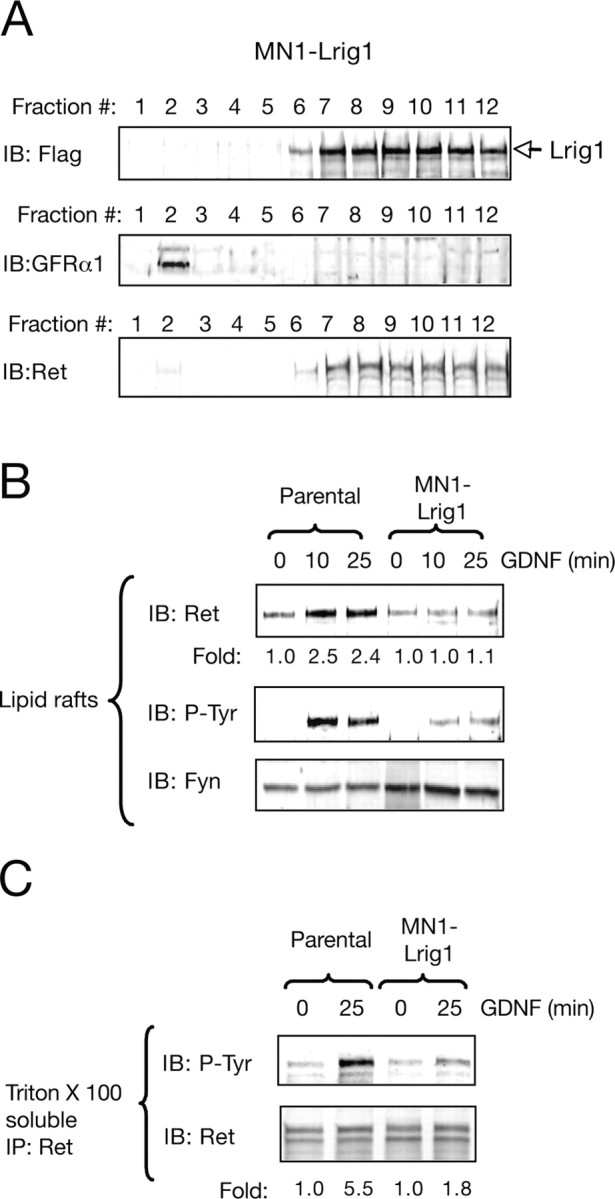
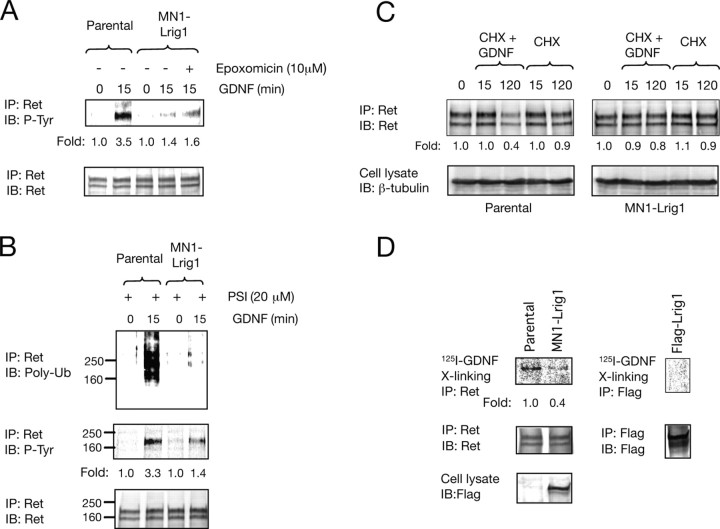
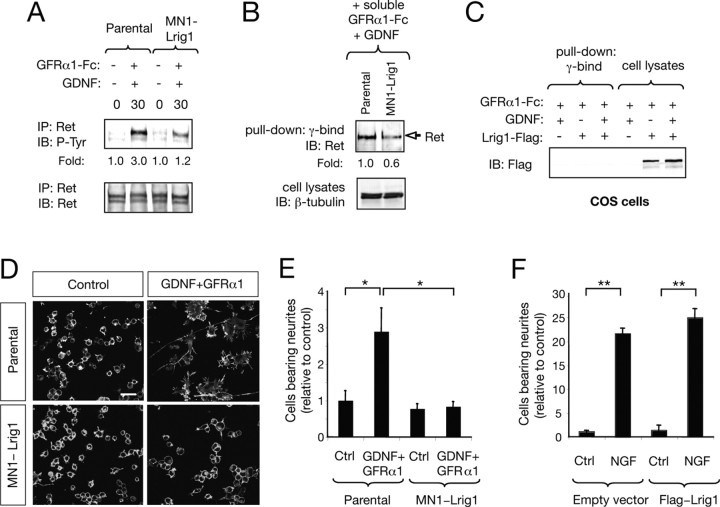
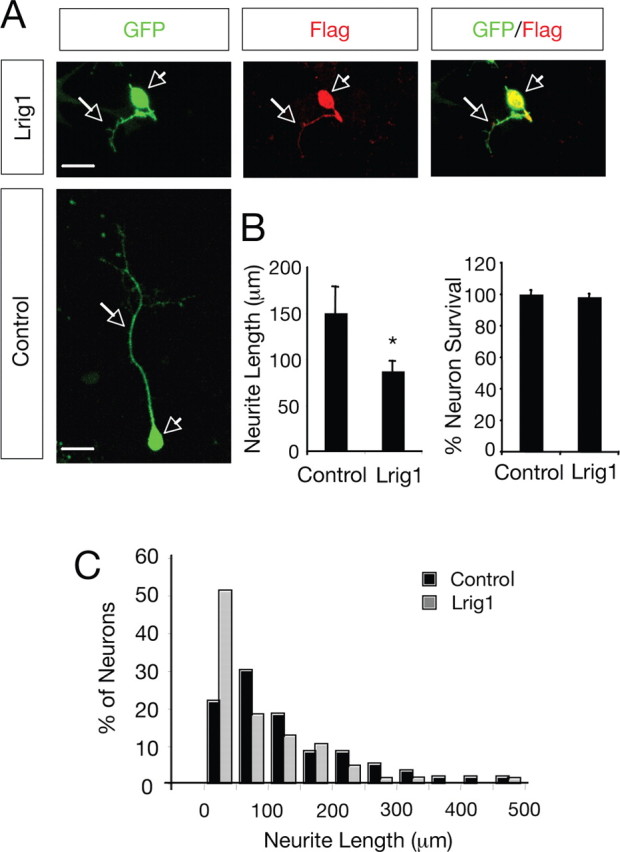
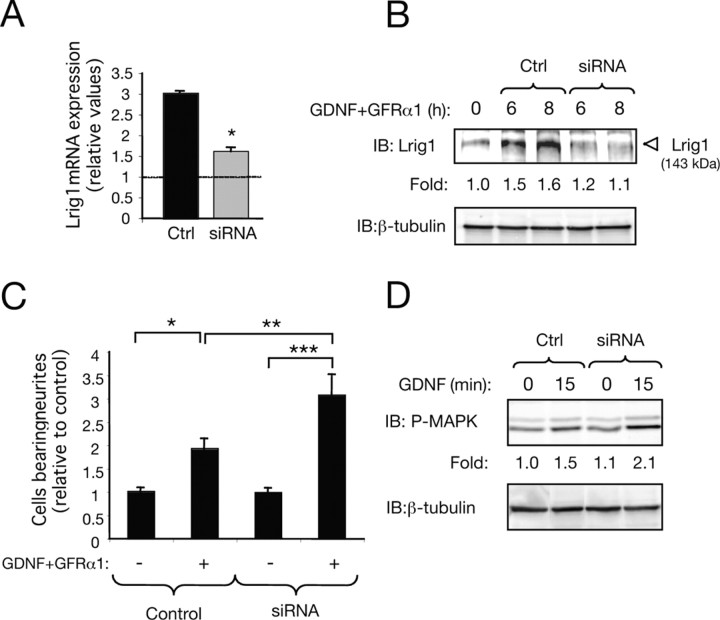
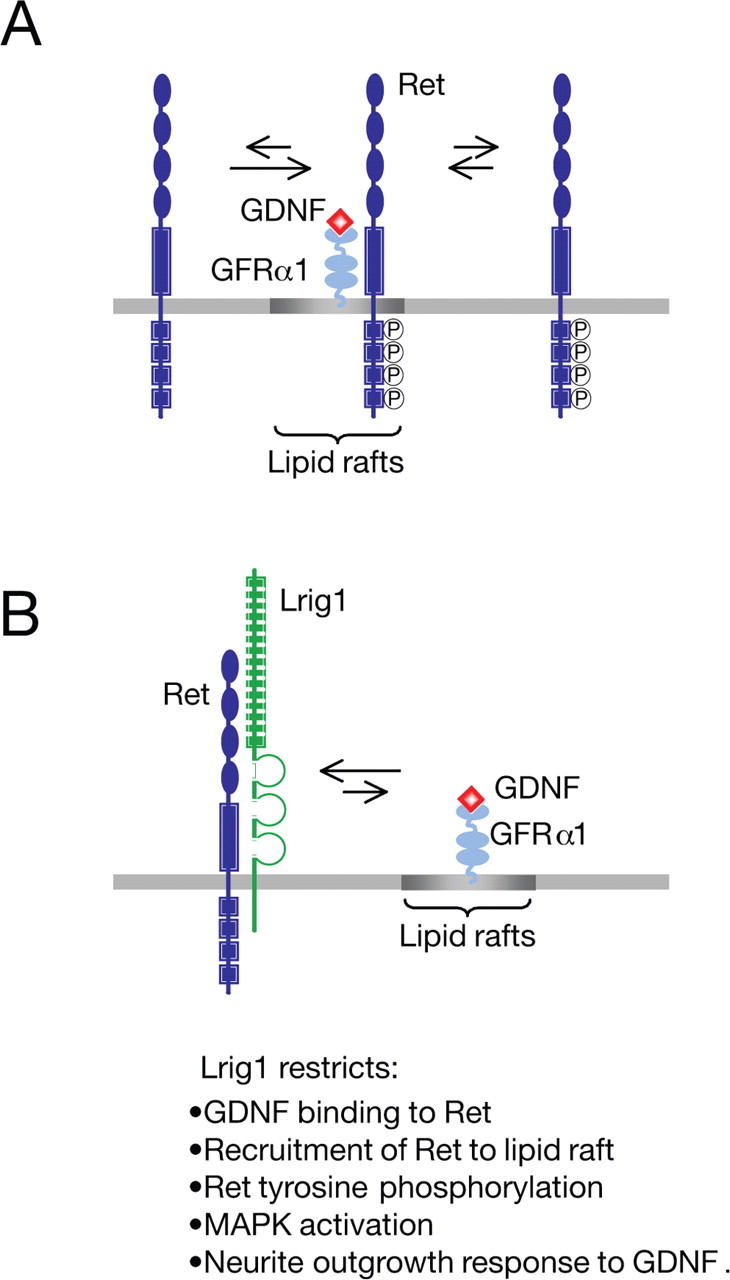
Glial cell line-derived neurotrophic factor (GDNF)/Ret signaling has potent trophic effects on ventral midbrain dopaminergic, motor, sensory, and sympathetic neurons. The molecular mechanisms that restrict Ret receptor tyrosine kinase activation are not well understood. Here, we show that Lrig1, a transmembrane protein containing leucine-rich repeats and Ig-like domains in its extracellular region, acts in a negative feedback loop to regulate the activity of Ret receptor tyrosine kinase. In particular, we demonstrate that Lrig1 is capable of physically interacting with Ret and that Lrig1/Ret association inhibits GDNF binding, recruitment of Ret to lipid rafts, receptor autophosphorylation, and mitogen-activated protein kinase (MAPK) activation in response to GDNF. In neuronal cells, Lrig1 overexpression also inhibits GDNF/Ret-induced neurite outgrowth in a cell-autonomous manner. Downregulation of Lrig1 using small interference RNA knock-down experiments potentiates both neuronal differentiation and MAPK activation in response to GDNF. Together, these results provide an insight into Lrig1 function and establish a new physiological mechanism to restrict signaling and biological responses induced by GDNF and Ret in neuronal cells.


Figures

Figure 1.
Figure 1.
Lrig1 interacts with the Ret receptor tyrosine kinase and is induced by GDNF signaling in neuronal cells. A, Coimmunoprecipitation between Flag-tagged Lrig1 (Flag-Lrig1) and Ret (left) or HA-TrkA (right) overexpressed in COS cells. Cell extracts were analyzed by immunoprecipitation (IP) with anti-Flag antibodies followed by immunoblot (IB) with antibodies against Ret or HA. Reprobing of the same blots with anti-Flag antibody is shown below. The bottom panels show Ret or HA-TrkA expression in total extracts. B, C, Quantitative analysis of Lrig1 mRNA expression by real-time PCR in MN1 cells (gray and black bars) (B) and SCG neurons (C), treated with GDNF (50 ng/ml) in the presence or absence of soluble GFRα1-Fc (150 ng/ml) during the indicated times. Histogram in B also shows Lrig1 mRNA expression in PC12 cells (white bars) treated with NGF (50 ng/ml). The levels of Lrig1 mRNA were normalized using the expression of the house-keeping gene Tbp. Shown are averages ± SD of triplicate determinations. *p < 0.01 versus control (Ctrl) group (1-way ANOVA followed by Dunnett's test). D, Western blot analysis of Lrig1 protein expression in MN1 cells treated with GDNF (100 ng/ml) or GDNF plus GFRα1-Fc (300 ng/ml). Reprobing control was done with antibodies against β-tubulin. Fold change relative to β-tubulin is indicated. E, Interaction between endogenous Ret and Flag-Lrig1 in MN1-Lrig1 cells in the absence of GDNF. Analysis was done by IP with antibodies against Flag epitope, followed by IB with anti-Ret antibodies. The bottom shows endogenous Ret expression in total MN1 cell extracts. F, Interaction between endogenous Ret and Lrig1 in parental MN1 cells treated with GDNF and GFRα1 (4 h). Analysis was done by IP with control or anti-Lrig1 antibodies, followed by IB with anti-Ret antibodies. Reprobing of the same blot with Lrig1 antibodies is shown below. The bottom shows endogenous Ret expression in total MN1 cell extracts.
Figure 2.
Figure 2.
Colocalization of Lrig1 and Ret in DRG and spinal cord (SC) motor neurons. A, Colocalization of Lrig1 and Ret in transverse spinal cord and DRG sections from P0 mice by immunofluorescence. Yellow indicates regions of colocalization. Scale bar, 50 μm. D–I, The areas shown in D–F and G–I represent higher-magnification images of the boxes B and C, respectively. Scale bars: D–F, 30 μm; G–I, 25 μm.
Figure 3.
Figure 3.
Lrig1 restricts Ret receptor tyrosine kinase phosphorylation and MAPK activation. A, Ret phosphorylation in parental MN1 and MN1-Lrig1 cells (clon L20) treated with GDNF (50 ng/ml) as indicated. Total lysates were immunoprecipitated (IP) with anti-Ret antibodies followed by immunoblot (IB) with antibodies against phosphotyrosine (P-Tyr). Reprobing of the same blot with anti-Ret antibodies is shown. Bottom shows Flag-Lrig1 expression in total extracts. B, The histogram shows the quantification of Ret phosphorylation in three stable clones (L2, L15, and L20). Results are presented as average ± SD from three independent experiments. *p < 0.005 (Student's t test). C, MAPK activation (P-MAPK) in cell lysates of MN1 parental and MN1-Lrig1 cells (clon L20) treated with GDNF and detected by IB. Reprobing of the same blot with anti β-tubulin and anti-Flag antibodies is shown. D, The histogram shows the quantification of MAPK phosphorylation in three stable clones. Results are presented as average ± SD from three independent experiments. *p < 0.05 (Student's t test).
Figure 4.
Figure 4.
Lrig1 abrogates the presence and activation of Ret in lipid raft microdomains. A, Sucrose gradient fractions of Triton X-100 lysates prepared from MN1-Lrig1 cells analyzed by immunoblotting (IB) for Lrig1, GFRα1, and Ret. B, Raft fractions (2–4) from parental MN1 and MN1-Lrig1 cells (clon L20) treated with GDNF (50 ng/ml) as indicated and analyzed by IB with Ret and phosphotyrosine (P-Tyr) antibodies. Reprobing of the same blot with anti-Fyn antibodies is shown below. Fold change relative to control is indicated. The experiment was repeated three times with similar results. C, Detergent soluble fractions (9–12) from parental MN1 and MN1-Lrig1 cells (clon L20) treated with GDNF analyzed by IB with Ret and p-Tyr antibodies. Reprobing of the same blot with anti-Ret antibodies are indicated in the bottom. The experiment was repeated three times with similar results. Fold change normalized to the levels of Ret is indicated.
Figure 5.
Figure 5.
Lrig1 attenuates Ret receptor tyrosine kinase activation by reducing GDNF binding to Ret. A, Ret phosphorylation in parental MN1 and MN1-Lrig1 cells treated with the proteasome inhibitor epoxomicin (10 μm) and stimulated with GDNF (50 ng/ml) as indicated. Total lysates were analyzed by immunoprecipitation (IP) with anti-Ret antibodies followed by immunoblot (IB) with antibodies against phosphotyrosine (P-Tyr). Reprobing of the same blot with anti-Ret antibodies are indicated in the bottom. The experiment was repeated two times with similar results. B, Ret ubiquitination in parental MN1 and MN1-Lrig1 cells treated with the PSI (20 μm) and stimulated with GDNF (50 ng/ml) as indicated. Total lysates were analyzed by IP with anti-Ret antibodies followed by IB with antibodies against poly-ubiquitin (Poly-Ub) and phosphotyrosine (P-Tyr). Reprobing of the same blot with anti-Ret antibodies are indicated in the bottom. The experiment was repeated two times with similar results. C, Parental and MN1 clones overexpressing Lrig1 were treated with the protein synthesis inhibitor CHX (15 μg/ml) in the absence or in the presence of GDNF (50 ng/ml) for the indicated period of times. Ret proteins were analyzed by IP from cell lysates, and receptor levels were assessed by IB. Cell lysates probed with β-tubulin are shown below. Fold of change normalized to the levels of β-tubulin is indicated. D, Affinity labeling of parental and MN1-Lrig1 cells (left) and Flag-Lrig1 transfected COS cells (right) with 125I-GDNF, followed by chemical cross-linking and IP with the indicated antibodies. The membranes were reprobed (IB) with Ret or Flag antibodies. Expression of Flag-Lrig1 proteins is shown in total cell lysates. Similar results were obtained in two additional MN1-Lrig1 clones.
Figure 6.
Figure 6.
Lrig1 inhibits neuronal differentiation of the immortalized motor neuron cell line MN1 in response to GDNF and GFRα1. A, Ret phosphorylation in parental MN1 and MN1-Lrig1 cells (clon L20) treated with GDNF (50 ng/ml) plus GFRα1-Fc (150 ng/ml) as indicated. Total lysates were immunoprecipitated (IP) with anti-Ret antibodies followed by immunoblot (IB) with antibodies against phosphotyrosine (P-Tyr). Reprobing of the same blot with anti-Ret antibodies are indicated in the bottom. The experiment was repeated two times with similar results. B, Pull down of endogenous Ret expressed in parental MN1 and MN1-Lrig1 cells with soluble GFRα1-Fc (150 ng/ml) added to living cells in the presence of GDNF (50 ng/ml). Cell lysates probed with β-tubulin are shown below. Fold change relative to β-tubulin is indicated. Similar results were obtained in two independent experiments. C, Pull down of Flag-Lrig1 expressed in COS cells with soluble GFRα1-Fc (150 ng/ml) added to living cells in the absence or presence of GDNF (50 ng/ml). Pull downs and cell lysates were probed by IB with antibodies against Flag. D, MN1 cell differentiation mediated by GDNF (100 ng/ml) and soluble GFRα1-Fc (300 ng/ml) is inhibited by Lrig1 overexpression. Photomicrographs show parental MN1 and MN1-Lrig1 (clon L20) cells stained with phalloidin, which reveals polymerized actin filaments. Scale bar, 25 μm. E, The histogram shows the quantification of the relative number of parental MN1 and MN1-Lrig1 (clon L20) cells bearing neurites longer than two cell body diameters after 72 h. of treatment with GDNF in the presence of soluble GFRα1-Fc. The results are presented as averages ± SD of a representative experiment performed in triplicate. *p < 0.01 (1-way ANOVA followed by Student–Newman–Keuls test). F, The histogram shows the quantification of the relative number of GFP-positive PC12 cells bearing neurites longer than 1.5 cell body diameter after 72 h of treatment with NGF (50 ng/ml). PC12 cells transfected with GFP in the absence (empty vector) or in the presence of Flag-tagged Lrig1 construct are indicated. The results are presented as averages ± SD of a representative experiment performed in triplicate. **p < 0.001 (1-way ANOVA followed by Student–Newman–Keuls test).
Figure 7.
Figure 7.
Lrig1 inhibits neurite outgrowth of SCG neurons in response to GDNF and GFRα1. A, Dissociated SCG neurons transfected with GFP in the absence (Control) or in the presence of Flag-tagged Lrig1 construct were cultured with GDNF and soluble GFRα1-Fc. After 36 h in culture, the neurons were fixed and stained with anti-Flag antibodies. Scale bar, 20 μm. Arrowheads indicates neuronal cell bodies and arrows denote neurites. B, Left, Histogram showing the inhibition of neurite outgrowth in SCG neurons by exogenous expression of Lrig1. The results are average ± SEM of four independent experiments. *p < 0.05 (Student's t test). Right, Histogram showing the neuronal survival in SCG neurons by exogenous expression of Lrig1. Neuronal survival was evaluated using the nuclear stain DAPI. GFP-positive neurons containing fragmented or condensed nuclear staining were scored as apoptotic cells. The results are average ± SD of a representative experiment performed in triplicate. C, The histogram shows the distribution of neurons carrying neurites in different length categories after transfection with GFP in the absence (Control) or in the presence of Flag-tagged Lrig1. Note the noticeable shift to the left of the distribution of neurons that received the Lrig1 construct.
Figure 8.
Figure 8.
Knock-down of Lrig1 by siRNA potentiates MAPK activation and neuronal differentiation of MN1 cells in response to GDNF. A, Lrig1 mRNA levels were analyzed by real-time PCR in MN1 cells transfected with scrambled [control (Ctrl)] or Lrig1 siRNA followed by 4 h of treatment with GDNF and soluble GFRα1-Fc. Fold changes relative to control cells (nontreated cells, dotted line) are indicated. Quantitative analysis is shown as averages ± SD of triplicate determinations. The levels of Lrig1 mRNA were normalized using the expression of the house-keeping gene Tbp. *p < 0.005 (Student's t test). B, Endogenous levels of Lrig1 protein were analyzed by immunoblot (IB) in MN1 cells transfected with scrambled (Ctrl) or Lrig1 siRNA after treatment with GDNF and soluble GFRα1-Fc. Numbers below the lanes indicate fold changes relative to control cells (nontreated cells) normalized to the levels of β-tubulin. C, Morphological differentiation of MN1 cells induced by GDNF (50 ng/ml) and soluble GFRα1 (150 ng/ml) was assessed in cells transfected with scrambled (Ctrl) or Lrig1 siRNA together with a plasmid encoding GFP. The histogram shows the quantification of the relative number of GFP positive neurite-bearing cells longer than 1.5 cell diameters in the different conditions. The results are shown as average ± SEM of a representative experiment performed in quadruplicates. ***p < 0.001; **p < 0.01; *p < 0.05 (1-way ANOVA followed by Student–Newman–Keuls test). D, Lrig1 knock-down on MAPK activation was analyzed in MN1 cells treated with GDNF (25 ng/ml) for 15 min. Numbers below the lanes indicate fold changes in MAPK activation normalized to the levels of β-tubulin. The experiment was repeated three times with similar results.
Figure 9.
Figure 9.
Model describing the proposed role of Lrig1 as a physiological inhibitor of Ret activation and recruitment to lipid rafts. A, During activation, GDNF binds to GPI-anchored GFRα1 coreceptors in lipid rafts, resulting in recruitment and activation of Ret in this compartment. Once activated, Ret is in equilibrium between raft and nonraft compartments. B, In the presence of Lrig1, a physical complex between Ret and Lrig1 is established. This interaction inhibits recruitment of Ret to lipid raft, ligand binding, receptor autophosphorylation, Ret-dependent downstream signaling, and neuronal differentiation in response to GDNF.

Similar articles

Cited by

References

    1. Airaksinen MS, Titievsky A, Saarma M. GDNF family neurotrophic factor signalling: four masters, one servant? Mol Cell Neurosci. 1999;13:313–325. - PubMed
    1. Airaksinen MS, Saarma M. The GDNF family: signalling, biological functions and therapeutic value. Nat Rev Neurosci. 2002;3:383–394. - PubMed
    1. Arevalo JC, Waite J, Rajagopal R, Beyna M, Chen ZY, Lee FS, Chao MV. Cell survival through Trk neurotrophin receptors is differentially regulated by ubiquitination. Neuron. 2006;50:549–559. - PubMed
    1. Basson MA, Akbulut S, Watson-Johnson J, Simon R, Carroll TJ, Shakya R, Gross I, Martin GR, Lufkin T, McMahon AP, Wilson PD, Costantini FD, Mason IJ, Licht JD. Sprouty1 is a critical regulator of GDNF/RET-mediated kidney induction. Dev Cell. 2005;8:229–239. - PubMed
    1. Chen Y, Aulia S, Li L, Tang BL. AMIGO and friends: an emerging family of brain-enriched, neuronal growth modulating, type I transmembrane proteins with leucine-rich repeats (LRR) and cell adhesion molecule motifs. Brain Res Rev. 2006;51:265–274. - PubMed

Publication types

MeSH terms

Substances