. 2008 Jan 2;28(1):228-38.
doi: 10.1523/JNEUROSCI.3490-07.2008.

Vasopressin increases locomotion through a V1a receptor in orexin/hypocretin neurons: implications for water homeostasis

Affiliations

Vasopressin increases locomotion through a V1a receptor in orexin/hypocretin neurons: implications for water homeostasis

Tomomi Tsunematsu et al. J Neurosci. .

Abstract

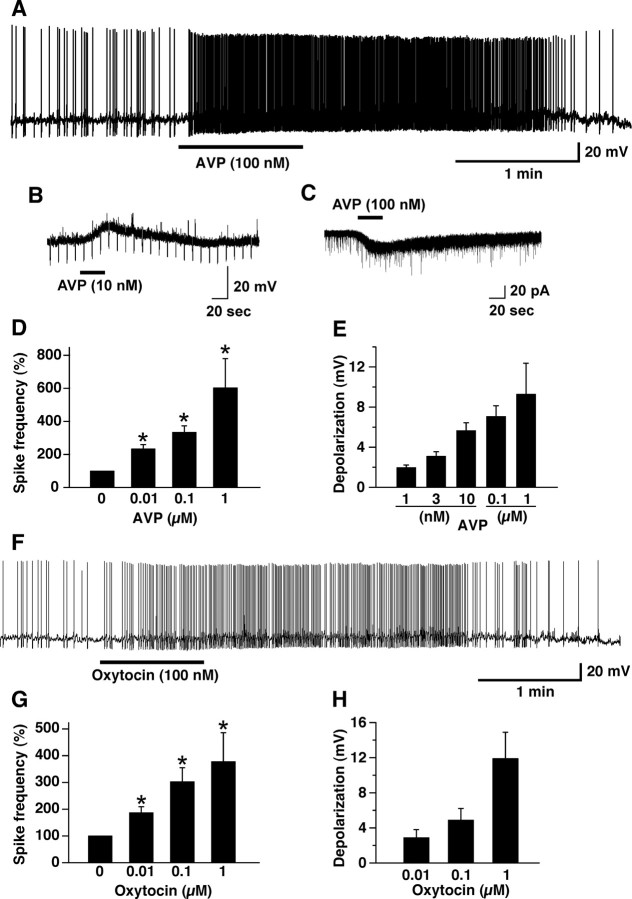
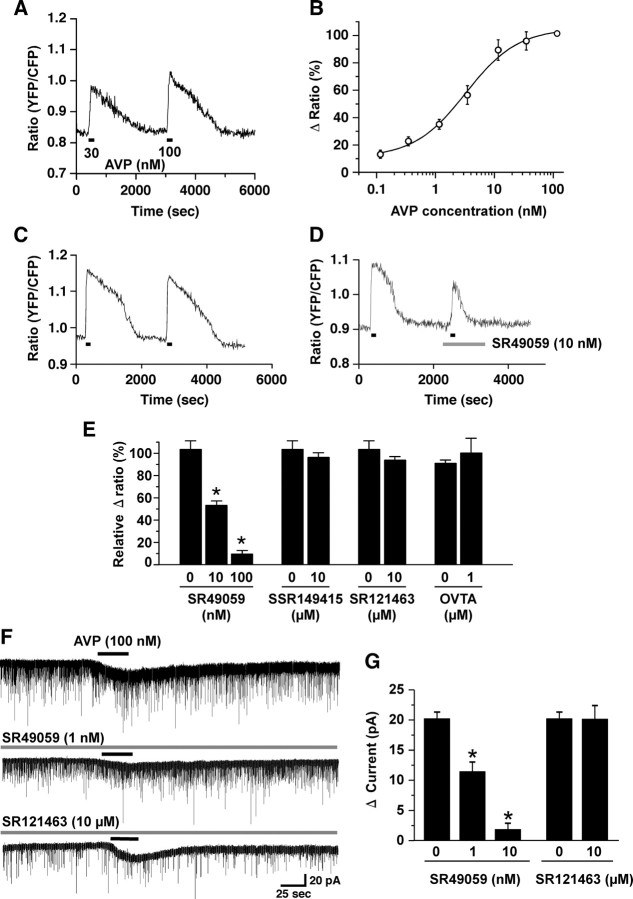
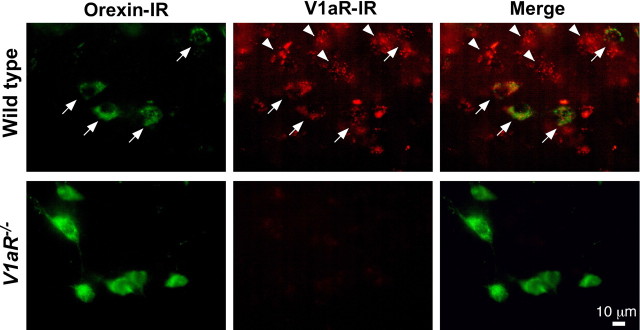
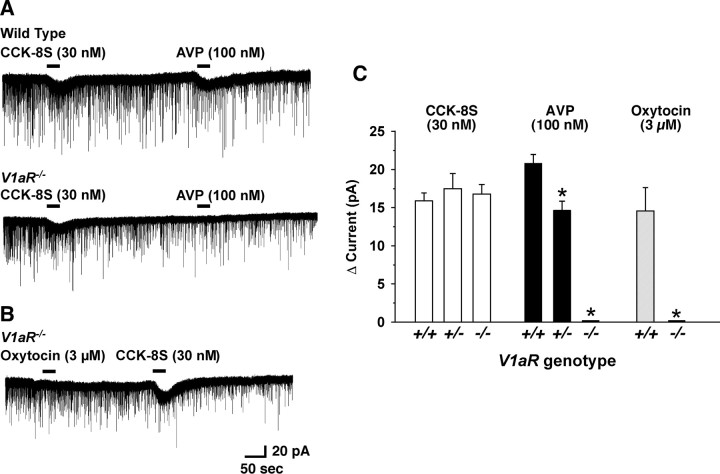
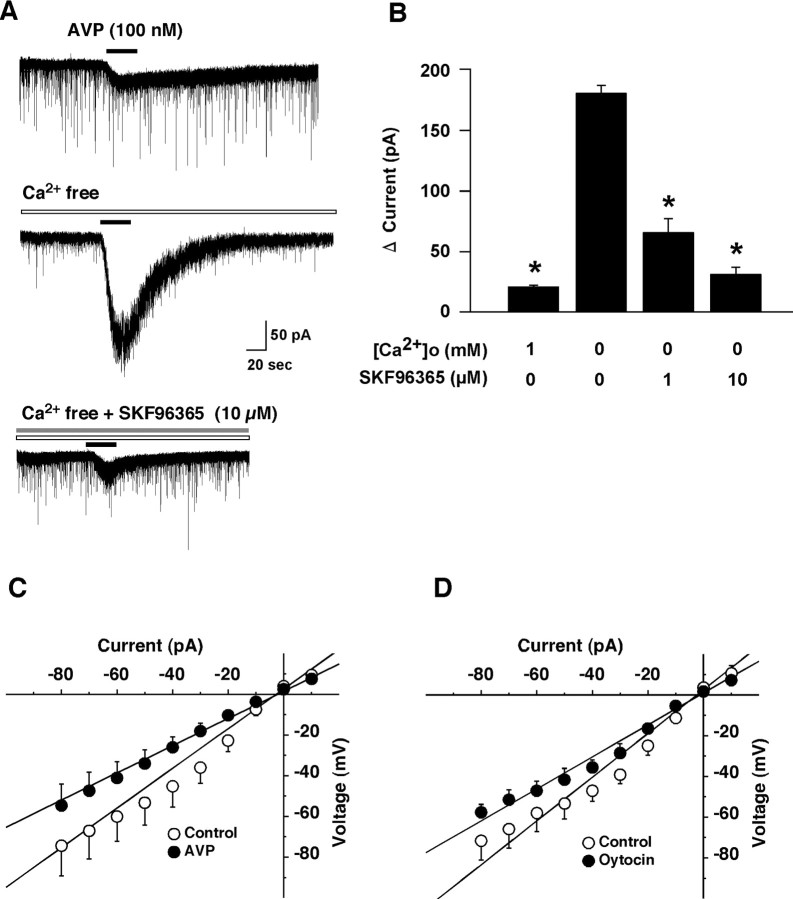
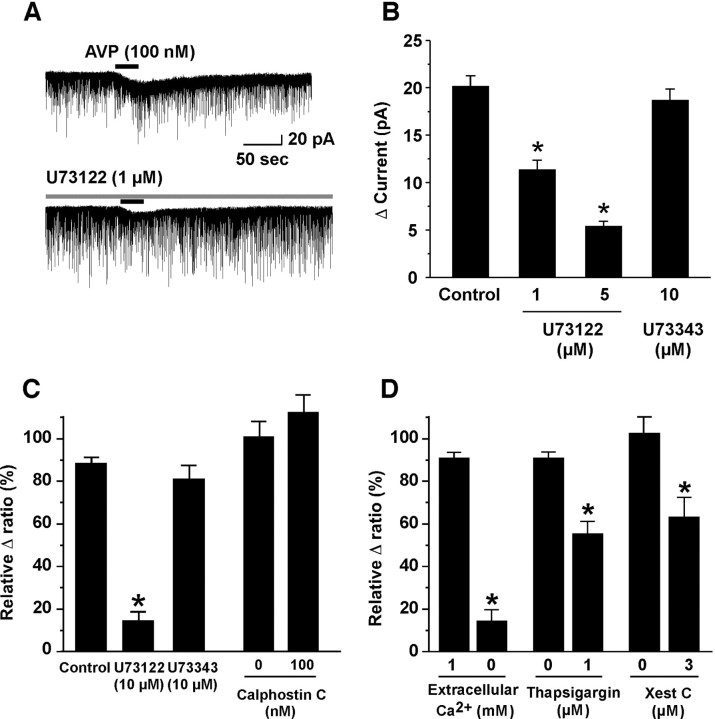
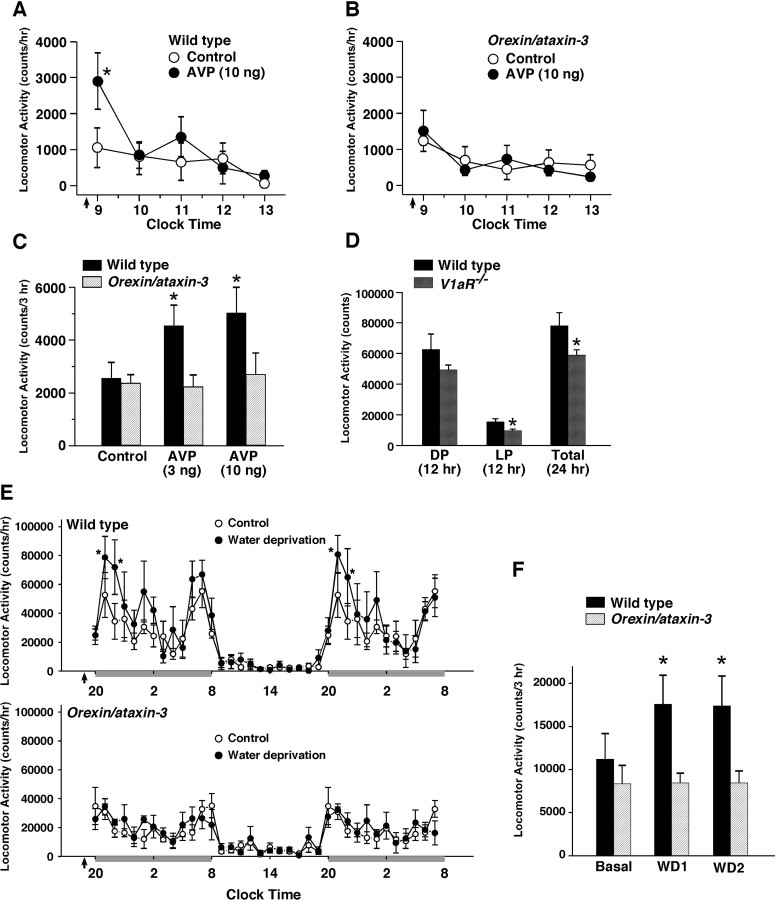
Water homeostasis is a critical challenge to survival for land mammals. Mice display increased locomotor activity when dehydrated, a behavior that improves the likelihood of locating new sources of water and simultaneously places additional demands on compromised hydration levels. The neurophysiology underlying this well known behavior has not been previously elucidated. We report that the anti-diuretic hormone arginine-vasopressin (AVP) is involved in this response. AVP and oxytocin directly induced depolarization and an inward current in orexin/hypocretin neurons. AVP-induced activation of orexin neurons was inhibited by a V1a receptor (V1aR)-selective antagonist and was not observed in V1aR knock-out mice, suggesting an involvement of V1aR. Subsequently activation of phospholipase Cbeta triggers an increase in intracellular calcium by both calcium influx through nonselective cation channels and calcium release from calcium stores in orexin neurons. Intracerebroventricular injection of AVP or water deprivation increased locomotor activity in wild-type mice, but not in transgenic mice lacking orexin neurons. V1aR knock-out mice were less active than wild-type mice. These results suggest that the activation of orexin neurons by AVP or oxytocin has an important role in the regulation of spontaneous locomotor activity in mice. This system appears to play a key role in water deprivation-induced hyperlocomotor activity, a response to dehydration that increases the chance of locating water in nature.


Figures

Figure 1.
Figure 1.
AVP and oxytocin excites orexin neurons. A, Under current-clamp mode, AVP (100 nm) application induced depolarization and an increase in firing in the orexin neurons. B, In the presence of TTX, AVP (10 nm) induced depolarization in the orexin neurons. C, Under voltage-clamp mode holding at −60 mV, AVP application induced an inward current in the orexin neurons in the presence of TTX. D, E, AVP induced an increase in firing (D) and depolarization (E) in a concentration-dependent manner. F, Under current-clamp mode, oxytocin application induced depolarization and an increase in firing in the orexin neurons. G, H, Oxytocin induced an increase in firing (G) and depolarization (H) in a concentration-dependent manner. Peptides were applied by local application during the period represented by bars. Values are represented as mean ± SEM. *p < 0.05.
Figure 2.
Figure 2.
V1aR is involved in AVP-induced activation of orexin neurons. A, B, AVP increased [Ca2+]i in the orexin neurons. AVP was applied by bath application during the period represented by bars. Orexin/YC2.1 transgenic mice brain slices were used for calcium imaging of orexin neurons. AVP increased [Ca2+]i in the orexin neurons in a concentration-dependent manner. The EC50 value was 2.8 ± 0.8 nm (n = 10–19). The Δ ratio is normalized to a high concentration of AVP application (100 nm). C, A repeated application of AVP (10 nm) induced the same magnitude of response. AVP (10 nm) was applied by bath application during the interval indicated by horizontal bars. D, E, SR49059, a V1a receptor-selective antagonist, inhibited AVP-induced increase in [Ca2+]i in the orexin neurons. The bar graph summarizes the effect of AVP and oxytocin receptor-selective antagonists on AVP-induced response in the orexin neurons. In each experiment, AVP (10 nm) was repeatedly applied to the same brain slice three to four times. The first application was AVP alone. This value was used for normalization of the following experiments. The second application was vehicle control. AVP was applied in the presence of each vehicle. The third and fourth AVP application was performed in the presence of the selective antagonist. SSR149415, a V1b receptor-selective antagonist; SR121463, a V2 receptor-selective antagonist; OVTA, a oxytocin receptor-selective antagonist. The number under the bar graph shows the concentration of the selective antagonist. 0 refers to vehicle control. F, AVP (100 nm)-induced inward current in the orexin neurons was inhibited by SR49059 in a concentration-dependent manner, but was not inhibited by SR121463 (10 μm). AVP (100 nm) was applied by local application during the period represented by bars. Antagonists were applied by bath application for 2 min before experiments. G, The bar graph summarizes the data in F. Values are represented as mean ± SEM. *p < 0.05.
Figure 3.
Figure 3.
Orexin neurons express V1aR. Orexin-immunoreactive neurons were located in the lateral hypothalamic area in the both wild-type (top) and V1aR−/− mice (bottom) (Alexa 488, green). V1aR-immunoreactive neurons were observed in the same area (Alexa 594, red). V1aR-ir was observed on the somata and dendrites. Immunoreactivity for orexin and V1aR overlaps in the merged image in the wild-type mice. Arrows indicate that orexin neurons express V1aR. Arrowheads indicate that a non-orexin neuron in the same area expressed V1aR as well. V1aR-ir was observed in neither the lateral hypothalamus nor the other brain area in the V1aR−/− mice. Scale bar, 10 μm.
Figure 4.
Figure 4.
AVP and oxytocin failed to induce an inward current in the orexin neurons in the V1aR−/− mice. A, Under voltage-clamp mode at a holding potential of −60 mV, CCK-8S (30 nm) and AVP (100 nm) were sequentially applied on the orexin neurons. The top trace is recorded from wild-type mice (V1aR+/+; orexin/EGFP mice). The bottom trace is recorded from V1aR−/− (V1aR−/−; orexin/EGFP mice) mice. Although CCK-8S (30 nm)-induced inward current was observed in both V1aR+/+ and V1aR−/− mice, AVP (100 nm)-induced inward current was completely abolished in the orexin neurons in the V1aR−/− mice. B, Oxytocin (3 μm) failed to induce inward current in orexin neurons in the V1aR−/− mice as well. C, The bar graph summarizes the data in A and B. Peptides were applied by local application during the period represented by bars. Values are represented as mean ± SEM. *p < 0.05.
Figure 5.
Figure 5.
Activation of nonselective cation channel is involved in the AVP-induced activation of orexin neurons. A, AVP-induced inward current was dramatically increased in Ca2+ free solution (middle trace, n = 7). This increased current was inhibited by pretreatment of SKF96365, a nonselective cation channel blocker, in a concentration-dependent manner. SKF96365 was applied by bath application for 2 min before experiment. AVP (100 nm) was applied by local application during the period represented by bars. B, The bar graph summarizes the data in A. C, D, Current–voltage relationship obtained by step current injection protocol using a CsCl pipette. C, The steady-state current at the end of the step current injection is plotted in a current–voltage relationship. I–V curve shows that the reversal potential of the AVP (1 μm) and oxytocin (1 μm)-induced current was 6.9 ± 1.2 mV (n = 6) and −3.1 ± 8.9 mV (n = 4), respectively. Under current-clamp mode, current was injected (−80 pA to 10 pA, in 10 pA increment at a duration of 200 ms). Open circles indicate control and filled circles indicate AVP (1 μm) or oxytocin (1 μm) application. Values are represented as mean ± SEM. *p < 0.05. [Ca2+]o, Extracellular calcium concentration.
Figure 6.
Figure 6.
Both calcium influx through nonselective cation channel and calcium release from intracellular calcium stores via an IP3 receptor are involved in AVP-induced activation of orexin neurons. A, B, U73122, a selective PLCβ inhibitor, inhibited AVP-induced inward current in a concentration-dependent manner. However, U73343, an inactive analog of U73122, had little effect on AVP-induced inward current. C, AVP-induced increase in [Ca2+]i was also inhibited by U73122. On the other hand, calphostin C, a selective PKC inhibitor, had little effect on it. D, AVP-induced increase in [Ca2+]i was almost abolished in the Ca2+ free extracellular solution. AVP-induced increase in [Ca2+]i was also inhibited by thapsigargin and xestospongin C, an inhibitor of ATP-dependent calcium uptake into the calcium store and a selective IP3 receptor antagonist, respectively. Values are represented as mean ± SEM. *p < 0.05. Xest C, Xestospongin C.
Figure 7.
Figure 7.
A, B, Intracerebroventricular injection of AVP increased spontaneous locomotor activity in the light period in wild-type mice but not in orexin/ataxin-3 mice. AVP was injected into the third ventricle. The arrow shows the timing of intracerebroventricular injection. Intracerebroventricular injection was initiated at 8:30 A.M. and was completed by 9:00 A.M. Saline alone was injected in the vehicle control experiment. The locomotor activity of individual mice for 5 h after intracerebroventricular injection was assessed with an infrared activity monitor in Plexiglas cages to which mice had been well habituated. C, The bar graph summarizes the data for 3 h after injection (9:00 A.M. to 12:00 P.M.) in A and B. D, Basal locomotor activity of V1aR−/− mice is lower than wild-type mice. Basal locomotor activity is the average of sequential recordings for 3 d. E, Water deprivation induced an increase in activity in the dark period in wild-type mice (top graph) but not in orexin/ataxin-3 mice (bottom graph). Water deprivation was started at the beginning of the dark period (arrows in the graph). The dark period is indicated by gray bars. F, The bar graph summarizes the data in E. The locomotor activity for 3 h (8:00–11:00 P.M.) was summarized. Values are represented as mean ± SEM. *p < 0.05. Orexin/ataxin-3, orexin/ataxin-3 transgenic mice. DP, Dark period (12 h: 8:00 P.M. to 8:00 A.M.). LP, Light period (12 h: 8:00 A.M. to 8:00 P.M.). Basal, Basal locomotor activity. WD1, Water deprivation in the first dark period. WD2, Water deprivation in the second dark period.

References

    1. Anthes N, Schmid HA, Hashimoto M, Riediger T, Simon E. Heterogeneous actions of vasopressin on ANG II-sensitive neurons in the subfornical organ of rats. Am J Physiol. 1997;273:R2105–2111. - PubMed
    1. Armstrong WE, Warach S, Hatton GI, McNeill TH. Subnuclei in the rat hypothalamic paraventricular nucleus: a cytoarchitectural, horseradish peroxidase and immunocytochemical analysis. Neuroscience. 1980;5:1931–1958. - PubMed
    1. Arnauld E, Bibene V, Meynard J, Rodriguez F, Vincent JD. Effects of chronic icv infusion of vasopressin on sleep-waking cycle of rats. Am J Physiol. 1989;256:R674–R684. - PubMed
    1. Arnhold MM, Wotus C, Engeland WC. Differential regulation of parvocellular neuronal activity in the paraventricular nucleus of the hypothalamus following single vs. repeated episodes of water restriction-induced drinking. Exp Neurol. 2007;206:126–136. - PMC - PubMed
    1. Bielsky IF, Hu SB, Ren X, Terwilliger EF, Young LJ. The V1a vasopressin receptor is necessary and sufficient for normal social recognition: a gene replacement study. Neuron. 2005;47:503–513. - PubMed

Publication types

MeSH terms

LinkOut - more resources