. 2008 Jan 2;28(1):292-303.
doi: 10.1523/JNEUROSCI.4276-07.2008.

Retinocollicular synapse maturation and plasticity are regulated by correlated retinal waves

Affiliations

Retinocollicular synapse maturation and plasticity are regulated by correlated retinal waves

Ruchir D Shah et al. J Neurosci. .

Abstract

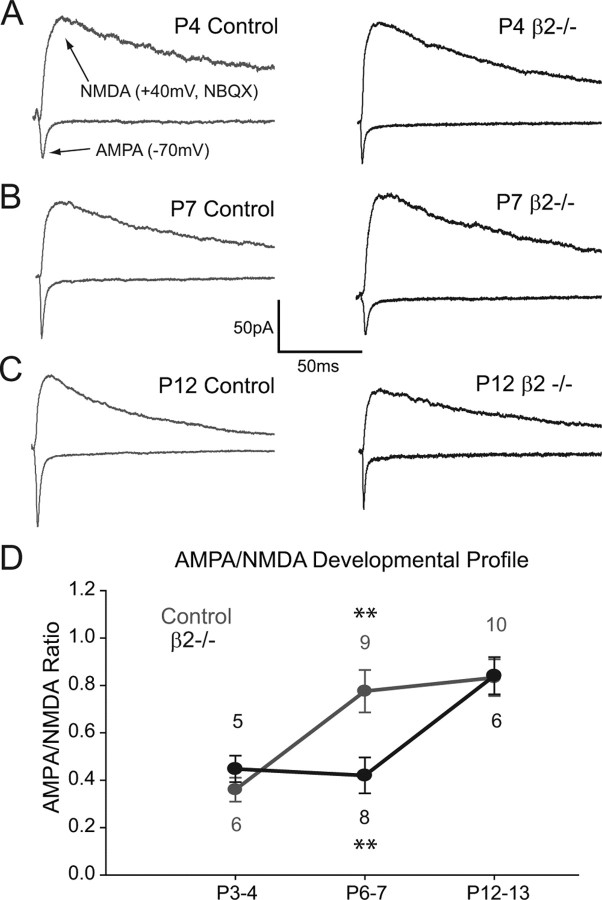
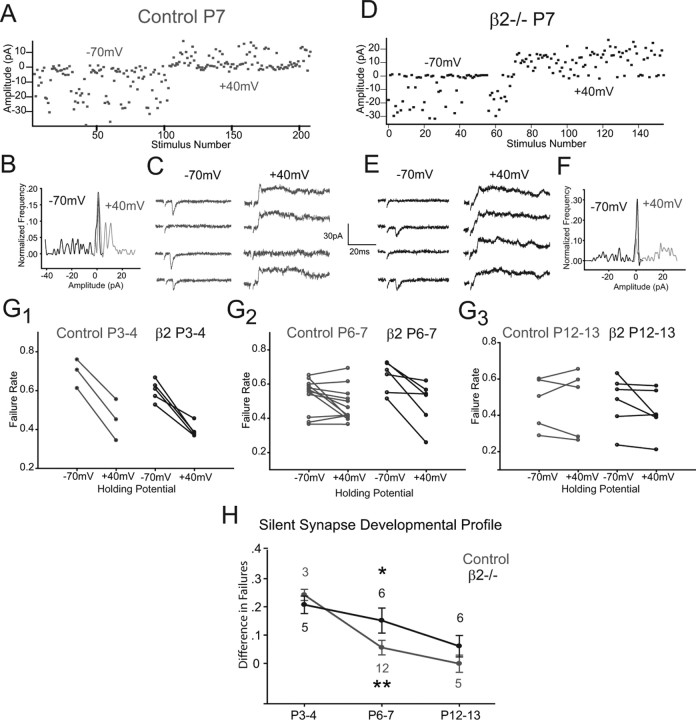
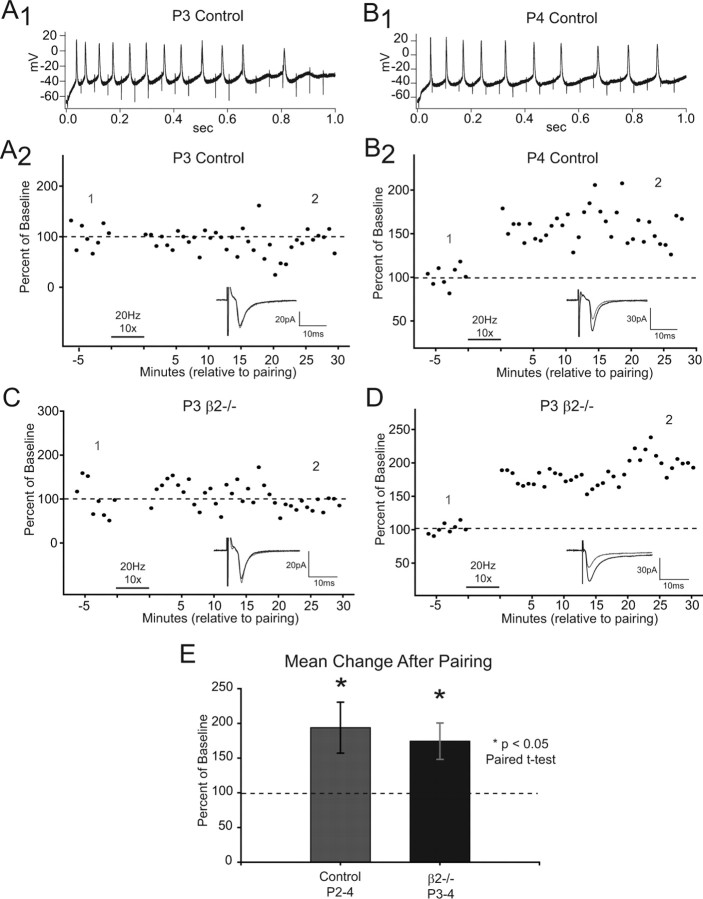
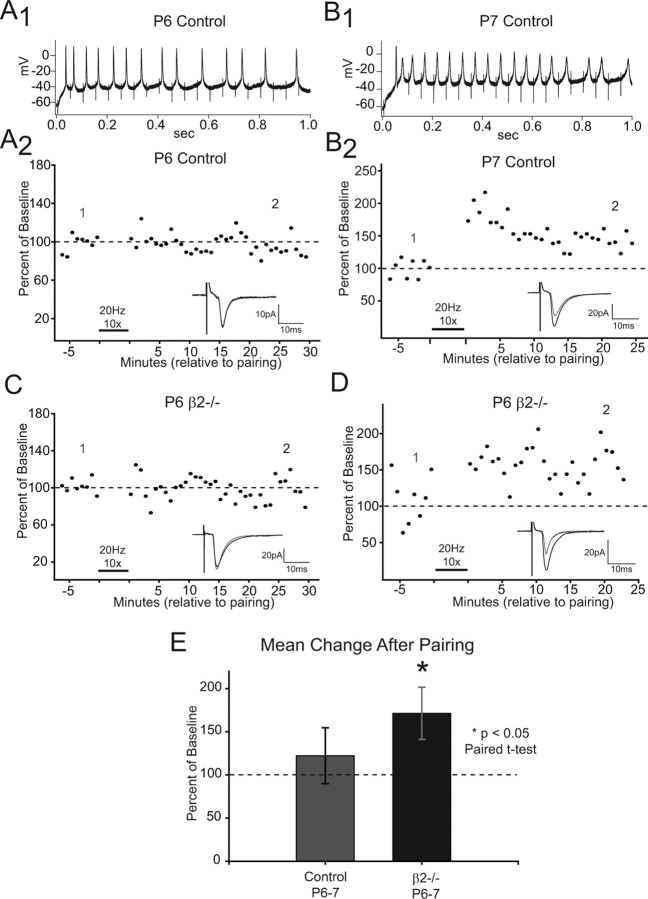
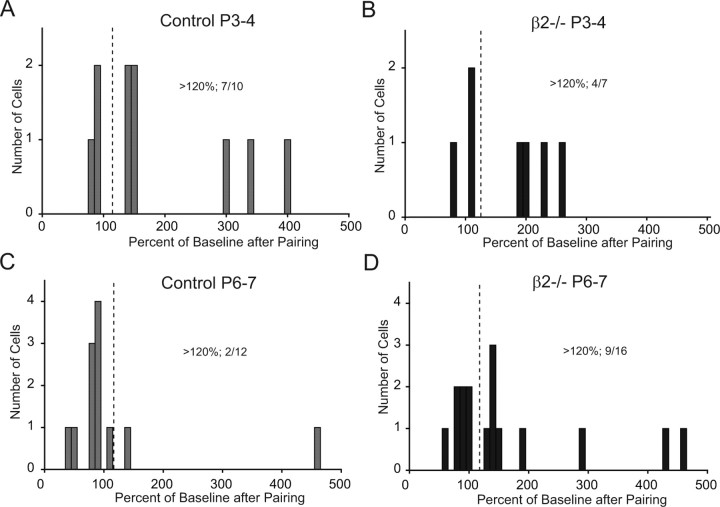
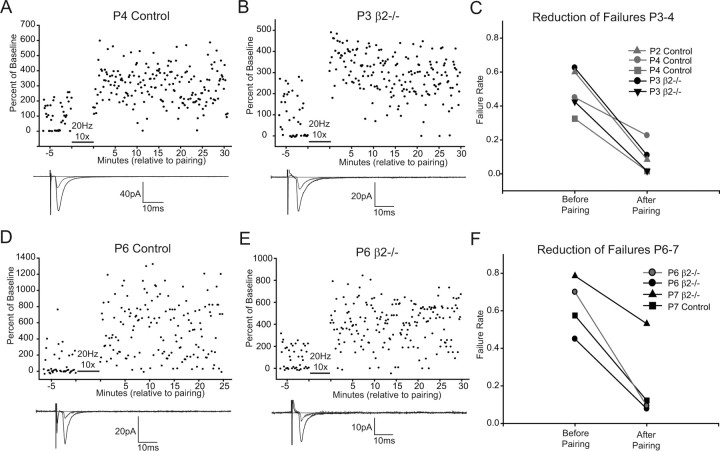
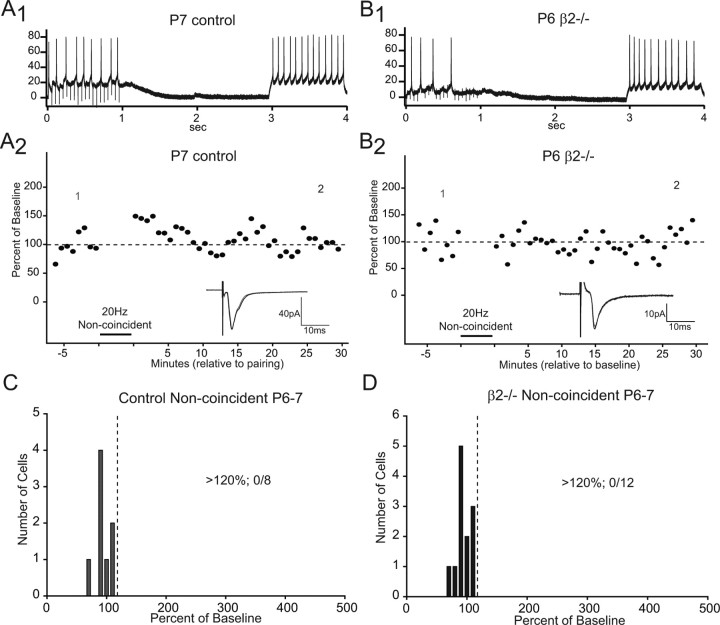
During development, spontaneous retinal waves are thought to provide an instructive signal for retinotopic map formation in the superior colliculus. In mice lacking the beta2 subunit of nicotinic ACh receptors (beta2-/-), correlated retinal waves are absent during the first postnatal week, but return during the second postnatal week. In control retinocollicular synapses, in vitro analysis reveals that AMPA/NMDA ratios and AMPA quantal amplitudes increase during the first postnatal week while the prevalence of silent synapses decreases. In age-matched beta2-/- mice, however, these parameters remain unchanged through the first postnatal week in the absence of retinal waves, but quickly mature to control levels by the end of the second week, suggesting that the delayed onset of correlated waves is able to drive synapse maturation. To examine whether such a mechanistic relationship exists, we applied a "burst-based" plasticity protocol that mimics coincident activity during retinal waves. We find that this pattern of activation is indeed capable of inducing synaptic strengthening [long-term potentiation (LTP)] on average across genotypes early in the first postnatal week [postnatal day 3 (P3) to P4] and, interestingly, that the capacity for LTP at the end of the first week (P6-P7) is significantly greater in immature beta2-/- synapses than in mature control synapses. Together, our results suggest that retinal waves drive retinocollicular synapse maturation through a learning rule that is physiologically relevant to natural wave statistics and that these synaptic changes may serve an instructive role during retinotopic map refinement.


Figures

Figure 1.
Figure 1.
Developmental increase in AMPA/NMDA ratios is delayed in β2−/− retinocollicular synapses. Using extracellular stimulation, AMPA responses were evoked at −70 mV holding potential, and NMDA responses were isolated at +40 mV holding potential in 10 μm NBQX. A, Example AMPA/NMDA ratios for a P4 control (left) and P4 β2−/− cell (right). B, Example traces from a P7 control (left) and P7 β2−/− (right) cell. C, Example traces from a P12 control (left) and P12 β2−/− (right) cell. D, Summary plot depicting the developmental profile of AMPA/NMDA ratio changes in control (gray) and β2−/− (black) synapses. Number of cells is written adjacent to each group. P6–P7 data points come from Chandrasekaran et al. (2007). In control synapses, there is a developmental increase in AMPA/NMDA ratios from P3–P4 to P6–P7 (**p < 0.01). This increase fails to occur in β2−/− synapses, resulting in lower AMPA/NMDA ratios for β2−/− cells at P6–P7 relative to controls (**p < 0.01). AMPA/NMDA ratios return to control values by P12–P13 in β2−/− synapses (p = 0.9), a period that coincides with the delayed onset of correlated retinal waves. Error bars indicate SEM.
Figure 2.
Figure 2.
Developmental increase in AMPA quantal amplitudes is delayed in β2−/− retinocollicular synapses. To examine the underlying locus of the AMPA/NMDA ratio changes, we used a strontium paradigm to desynchronize vesicle release at evoked retinocollicular synapses and isolate AMPA miniature events. A, Synchronous AMPA responses were initially evoked in 2 mm Ca2+ (top traces), and the bath solution was subsequently replaced with 3 mm Sr2+ (bottom traces). Examples of desynchronized AMPA events are shown for a P7 control cell (left) and a P7 β2−/− cell (right). Note the absence of large amplitude events in the β2−/− example. B, Amplitude frequency histograms were constructed using 1 pA bins, normalized by the number of events in each experiment, and then averaged across experiments. The normalized histograms are shown for control (filled gray bars) and β2−/− (open black bars) cells at P3–P4 (B 1), P6–P7 (B 2), and P12–P13 (B 3). C, Cumulative probability distributions were computed by integrating over the frequency histograms. The distributions are shown for control (gray lines) and β2−/− (black lines) experiments at P3–P4 (C 1), P6–P7 (C 2), and P12–P13 (C 3). P6–P7 data comes from Chandrasekaran et al. (2007). Note the leftward shift in the probability distributions for the β2−/− group at P6–P7 relative to the control group, indicating a greater percentage of small amplitude events. D, Summary of the developmental profile for mean AMPA miniature amplitude between controls (gray) and β2−/− (black). There is a significant increase in AMPA mini-amplitudes in control synapses from P3–P4 to P6–P7 (**p < 0.01). Like the AMPA/NMDA ratios, this increase fails to occur in β2−/− synapses, resulting in lower mean amplitudes for β2−/− cells at P6–P7 relative to controls (*p < 0.05). AMPA miniature amplitudes also return to control values by P12–P13 in β2−/− synapses (p = 0.3), suggesting that at least part of the AMPA/NMDA ratio changes are attributable to developmental increases in the synaptic AMPA component. Error bars indicate SEM.
Figure 3.
Figure 3.
β2−/− animals retain a higher number of silent synapses than controls after the first postnatal week. A, Example minimal stimulation experiment for a P7 control cell, showing amplitudes of all events (mixture of failures and successes) evoked at −70 mV holding potential and +40 mV holding potential. B, Amplitude frequency histogram of example shown in A, normalized to the number of events at each holding potential. Note similar peaks around 0 pA for each curve (−70 mV in black; +40 mV in gray). C, Example traces from experiment shown in A, showing AMPA-mediated successes and failures at −70 mV (left) and the mixed AMPA and NMDA currents at +40 mV (right). Stimulus artifacts have been removed for clarity. D, Example minimal stimulation experiment for a P7 β2−/− cell, as described in A. E, Example traces from experiment shown in D, showing AMPA-mediated successes and failures at −70 mV (left) and the mixed AMPA and NMDA currents at +40 mV (right). Note appearance of purely NMDA-mediated responses at +40 mV. F, Normalized amplitude frequency histograms of example shown in D. Note lower peak for +40 mV curve (gray) at 0 pA relative to −70 mV curve (black). G, Failure rates were computed for each experiment at each holding potential, and are depicted as paired ladder plots. Plots for all experiments in control cells (gray lines) and β2−/− cells (black lines) are shown at P3–P4 (G 1), P6–P7 (G 2), and P12–P13 (G 3). H, Summary of the developmental profile for the prevalence of silent synapses in control and β2−/− mice, as measured by the difference in failure rates for each experiment (−70 mV minus +40 mV) averaged across groups. A lower failure rate at +40 mV is indicative of NMDAR-only synapses. A similarly high difference in failure rates is apparent at P3–P4 in both genotypes (p = 0.5), revealing the presence of silent synapses early in retinocollicular development. In control synapses, there is a significant decrease in the mean difference in failure rates from P3–P4 to P6–P7 (**p < 0.01), although it should be noted that some control cells still displayed lower failure rates at +40 mV (G 2). This decrease fails to occur in β2−/− synapses, resulting in higher differences for β2−/− cells at P6–P7 relative to controls (*p < 0.05). The percentage of silent synapses returns to control levels by P12–P13 in β2−/− cells (p = 0.25), suggesting a retinal-wave-dependent developmental program of synapse unsilencing in the retinocollicular pathway. Error bars indicate SEM.
Figure 4.
Figure 4.
A coincident, burst-based pairing protocol results in heterogeneous plasticity, but LTP on average in control and β2−/− synapses at P3–P4. To mimic coincident activity during retinal waves, our plasticity protocol consisted of pairing a 1-s-long postsynaptic current injection to the SC neuron under current clamp with a simultaneous 1-s-long 20 Hz presynaptic burst delivered extracellularly to RGC axons 10 times every 30 s, after which the recording was switched back to voltage clamp and the initial AMPA response amplitude monitored for any change. The burst-based plasticity protocol resulted in similar plasticity outcomes at P3–P4 in the control and β2−/− populations that consisted of both LTP and no change in AMPA response amplitude, as shown in A 2, B 2, C, and D. All points in A 2–D are the average of five sweeps and are normalized to the mean of the baseline. The dashed line represents 100% of baseline. The insets show example traces of the average of the last 5 min of the baseline (1, gray) and the average of the last 5 min of the recording (2, black), which were the values used to define plasticity during analysis. A 1, Example current-clamp record for one pairing during the plasticity protocol in a P3 control cell, depicting the spikes evoked postsynaptically and the 20 Hz stimulation artifacts. A 2, Pairing experiment in a P3 control cell (from A 1) that resulted in no change in AMPA response amplitude. B 1, Example current-clamp record during pairing in a P4 control cell. B 2, Experiment from a P4 control cell (from B 1) that resulted in LTP. C, Experiment in a P3 β2−/− cell that resulted in no change. D, Experiment in a P3 β2−/− cell that resulted in LTP. E, Summary of mean change after pairing. Each bar shows the mean change ± SEM for all P2–P4 control cells (gray; n = 10) and P3–P4 β2−/− cells (black; n = 7). Regardless of the heterogeneity in plasticity outcomes, LTP was induced on average in each group, as measured by a paired t test (*p < 0.05). These results suggest that the statistics of RGC bursting during retinal waves are capable of inducing synaptic strengthening at immature retinocollicular synapses, providing a potential mechanism for the observed synaptic maturation.
Figure 5.
Figure 5.
The capacity for LTP is reduced by P6–P7 in more mature control synapses, but is retained among immature β2−/− synapses. The plasticity protocol used at P6–P7 was the same as described in Figure 4 for P3–P4 cells, and all graphs in A 2–D are plotted as described in Figure 4, A 2–D. A 1, Example current-clamp record during a pairing for a P6 control cell, depicting the spikes evoked postsynaptically and the 20 Hz stimulation artifacts. A 2, Experiment from a P6 control cell (from A 1) that resulted in no change in AMPA response amplitude. B 1, Example current-clamp record during a pairing for a P7 control cell. B 2, Experiment from a P7 control cell (from B 1) that resulted in LTP. C, Experiment from a P6 β2−/− cell that resulted in no change. D, Experiment from a P6 β2−/− cell that resulted in LTP. E, Summary of mean change after pairing, where plasticity was defined as the average amplitude of the last 5 min of the recording compared with the average amplitude of the last 5 min of the baseline. Each bar shows the mean change ± SEM after pairing for all control cells (gray; n = 12) and β2−/− cells (black; n = 16) at P6–P7. At this age, many fewer control cells displayed LTP, resulting in no change average (paired t test, p = 0.5). The immature β2−/− synapses, however, still retained the ability to show LTP on average, as measured using a paired t test (*p < 0.05). This result reveals that synaptic populations that are immature on average also show LTP on average, providing a potential mechanism for the observed synaptic maturation. After synaptic strengthening and maturation has already occurred, the ability to undergo LTP is greatly diminished, perhaps reflecting a metaplastic model of circuit development (see Discussion for explanation).
Figure 6.
Figure 6.
Summary of all plasticity outcomes at P3–P4 and P6–P7. All plasticity outcomes are expressed as percentage of baseline, placed into 10% bins, and plotted as frequency histograms. LTP was defined as >120% of baseline, and no change was defined as 80–120% of baseline. The vertical dashed line represents 120% threshold. A, Summary of all control P3–P4 experiments, with 7 of 10 showing LTP. B, Summary of all β2−/− P3–P4 experiments, with 4 of 7 showing LTP. C, Summary of all control P6–P7 experiments, with 2 of 12 showing LTP. D, Summary of all β2−/− P6–P7 experiments, with 9 of 16 showing LTP. Using a Mann–Whitney U test, we find that the control P3–P4 distribution is different from the control P6–P7 distribution (p < 0.05), whereas the β2−/− distributions at P3–P4 and P6–P7 are not significantly different (p = 0.6). The β2−/− P6–P7 distribution is, however, different from the control P6–P7 group (p < 0.05). Using χ2 statistics, we also tested whether the frequency of LTP differs across ages and genotypes. The probability of finding LTP is greater in control P3–P4 cells than in control P6–P7 cells (control P3–P4, 7 of 10; control P6–P7, 2 of 12; p < 0.05), whereas the frequency of LTP remains similar across ages for β2−/− cells (β2−/− P3–P4, 4 of 7; β2−/− P6–P7, 9 of 16; p = 0.9). Accordingly, the frequency of LTP is greater in β2−/− P6–P7 cells than in control P6–P7 cells (control P6–P7, 2 of 12; β2−/− P6–P7, 9 of 16; p < 0.05). These results confirm that the plasticity outcomes differ among the immature and mature synaptic populations, and that the probability of inducing LTP decreases after synaptic strengthening and maturation have occurred.
Figure 7.
Figure 7.
The burst-based plasticity protocol is able to unsilence synapses across all ages and genotypes. In the subset of experiments with an initially high failure rate (>30%), the burst-based plasticity protocol resulted in a large LTP that consisted of a reduction in the number of AMPA-mediated failures and typically an increase in the amplitude of the successes. A, Example reduction of failure experiment for a P4 control cell. Each point represents one sweep collected at 0.1 Hz and is normalized to the mean of the baseline. Example traces (bottom) depict averages of the last 5 min of the baseline (gray) and averages of the last 5 min of the recording (black). B, Example reduction of failure experiment for a P3 β2−/− cell. C, Paired ladder plots of all reduction of failure experiments at P2–P4, with the failure rate before and after pairing shown for three control cells and two β2−/− cells. D–F, Same as A–C, but for all reduction of failure experiments at P6–P7. These results are consistent with the burst-based plasticity protocol unsilencing immature synapses, thereby reproducing the synaptic changes normally observed over development and providing a potential mechanism for retinal-wave-dependent synaptic maturation. However, it should be noted that a true unsilencing is not confirmed, because we were not able to compare the failure rates at −70 mV against those at +40 mV before and after pairing for each experiment.
Figure 8.
Figure 8.
The burst-based learning rule is Hebbian and requires coincident presynaptic and postsynaptic activity. To test the effects of presynaptic and postsynaptic stimulation alone on retinocollicular synaptic efficacy, we applied the same burst-based plasticity protocol at P6–P7, but separated the onset of the presynaptic burst and the postsynaptic current injection by 3 s. Here, we are eliminating the coincident activity between RGCs and SC neurons, a necessary substrate for Hebbian changes. All plasticity experiments are plotted as described in Figure 4, A 2–D. A 1, Example current-clamp record from a noncoincident pairing experiment for a P7 control cell. The first second is the 20 Hz presynaptic stimulation alone, and the last second is the postsynaptic current injection. A 2, Experiment for a P7 control cell (from A 1) that resulted in no change in AMPA response amplitude. B 1, Example current-clamp record from a noncoincident pairing experiment for a P6 β2−/− cell, as described in A 1. B 2, Experiment for a P6 β2−/− cell (from B 1) that resulted in no change in AMPA response. C, Summary of all noncoincident plasticity experiments at P6–P7 for control cells. All plasticity outcomes are expressed as percentage of baseline, placed into 10% bins, and plotted as frequency histograms. D, Summary of all noncoincident plasticity experiments at P6–P7 for β2−/− cells, as described for C. Under these noncoincident conditions, LTP was never induced in either groups (0 of 8 for controls; 0 of 12 for β2−/−). The paired t test reveals no change on average (control P6–P7, p = 0.6; β2−/− P6–P7, p = 0.5), and the Mann–Whitney U test reveals that the control and β2−/− distributions are not significantly different from one another (p = 0.8). These results confirm that coincident bursting activity is required to induce plasticity at retinocollicular synapses, consistent with a Hebbian synaptic learning rule.

Similar articles

Cited by

References

    1. Bansal A, Singer JH, Hwang BJ, Xu W, Beaudet A, Feller MB. Mice lacking specific nicotinic acetylcholine receptor subunits exhibit dramatically altered spontaneous activity patterns and reveal a limited role for retinal waves in forming ON and OFF circuits in the inner retina. J Neurosci. 2000;20:7672–7681. - PMC - PubMed
    1. Bi GQ, Poo MM. Synaptic modifications in cultured hippocampal neurons: dependence on spike timing, synaptic strength, and postsynaptic cell type. J Neurosci. 1998;18:10464–10472. - PMC - PubMed
    1. Butts DA. Retinal waves: implications for synaptic learning rules during development. Neuroscientist. 2002;8:243–253. - PubMed
    1. Butts DA, Rokhsar DS. The information content of spontaneous retinal waves. J Neurosci. 2001;21:961–973. - PMC - PubMed
    1. Butts DA, Kanold PO, Shatz CJ. A burst-based “Hebbian” learning rule at retinogeniculate synapses links retinal waves to activity-dependent refinement. PLoS Biol. 2007;5:e61. - PMC - PubMed

Publication types

MeSH terms

Substances

LinkOut - more resources