. 2008 Jan 2;28(1):325-35.
doi: 10.1523/JNEUROSCI.3544-07.2008.

Heterogeneity in synaptic vesicle release at neuromuscular synapses of mice expressing synaptopHluorin

Affiliations

Heterogeneity in synaptic vesicle release at neuromuscular synapses of mice expressing synaptopHluorin

Ryan M Wyatt et al. J Neurosci. .

Abstract

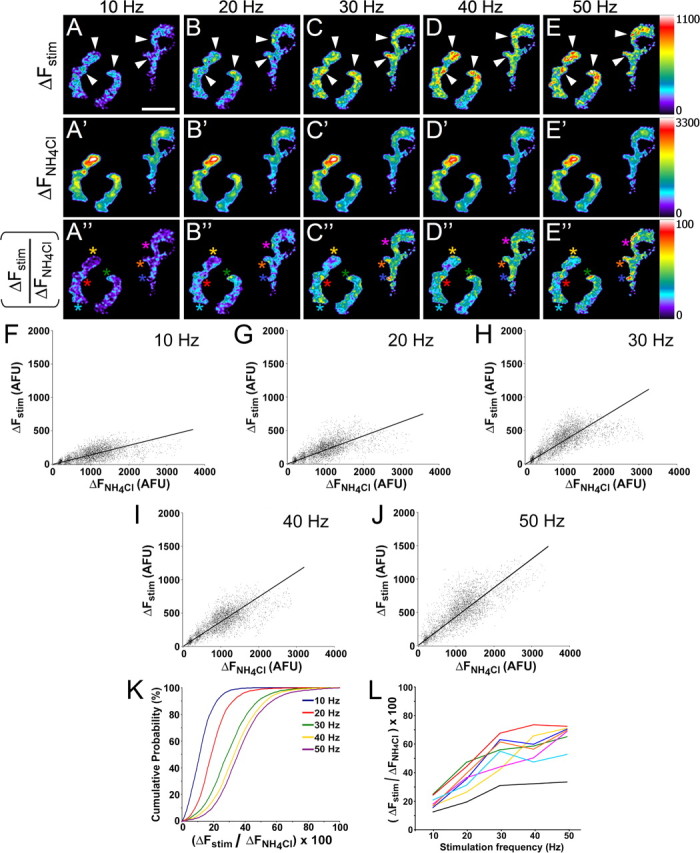
Mammalian neuromuscular junctions are useful model synapses to study the relationship between synaptic structure and function, although these have rarely been studied together at the same synapses. To do this, we generated transgenic lines of mice in which the thy1.2 promoter drives expression of synaptopHluorin (spH) as a means of optically measuring synaptic vesicle distribution and release. SpH is colocalized with other synaptic vesicle proteins in presynaptic terminals and does not alter normal synaptic function. Nerve stimulation leads to readily detectable and reproducible fluorescence changes in motor axon terminals that vary with stimulus frequency and, when compared with electrophysiological recordings, are reliable indicators of neurotransmitter release. Measurements of fluorescence intensity changes reveal a surprising amount of heterogeneity in synaptic vesicle release throughout individual presynaptic motor axon terminals. Some discrete terminal regions consistently displayed a greater rate and extent of release than others, regardless of stimulation frequency. The amount of release at a particular site is highly correlated to the relative abundance of synaptic vesicles there, indicating that a relatively constant fraction of the total vesicular pool, approximately 30%, is released in response to activity. These studies reveal previously unknown relationships between synaptic structure and function at mammalian neuromuscular junctions and demonstrate the usefulness of spH expressing mice as a tool for studying neuromuscular synapses in adults, as well as during development and diseases that affect neuromuscular synaptic function.


Figures

Figure 1.
Figure 1.
SynaptopHluorin expression at mouse neuromuscular junctions. A, B, Confocal imaging of fixed sternomastoid muscles reveals patterns of transgene expression among different thy1-spH lines. Junctions were identified by labeling postsynaptic AChRs with Alexa 594 conjugated α-bungarotoxin (Al594-αbtx; red). Tissue fixation neutralizes the pH gradient across the vesicle membrane, allowing for the visualization of both the intracellular and extracellular spH pool. A, SpH (green) is expressed at nearly every junction in line SpH 49 (yellow in overlay, 98.7% of junctions examined). Scale bar, 70 μm. B, Approximately half of the junctions are spH-expressing in line SpH 26 (54.1% of junctions examined). Scale bar, 50 μm. C, SpH is highly localized to presynaptic terminal branches (arrow) and completely overlies postsynaptic AChRs. Much lower levels are also present in preterminal axon branches (arrowhead). The image is from line SpH 49. Scale bar, 20 μm.
Figure 2.
Figure 2.
Changes in spH fluorescence are dependent on neural activity. A, Raw fluorescence images of a spH-expressing neuromuscular junction. Resting fluorescence intensity (second panel) increases in response to nerve stimulation (third panel) but returns to near original levels 60 s later (fourth panel). Addition of 50 mm NH4Cl causes a robust increase in fluorescence (right panel). Postsynaptic AChRs are visualized with Al594-αbtx (left panel). Scale bar, 10 μm. B, Mean spH fluorescence intensities of terminals at rest (487 ± 73 AFU), stimulated at 50 Hz for 15 s (688 ± 80 AFU), and exposed to NH4Cl (1344 ± 112 AFU). Error bars indicate SEM. C, Fluorescence changes (ΔF) of a junction stimulated with action potential trains of various frequencies. The magnitude of fluorescence change increases with stimulus intensity up to 30–40 Hz. Prestimulus fluorescence levels are offset to zero for each trial. D, Graph showing fluorescence changes of six junctions (colored traces) in response to a stimulus train of 50 Hz. The observed intensity changes are largely reproducible between junctions in response to a stimulus of a specific frequency and duration. Black trace shows averaged ΔF for these junctions. E, Averaged results from six junctions that were initially stimulated in the presence of Rees' Ringer's solution (red trace), a calcium-free Ringer's (blue trace), and back in the normal solution (green trace). Activity induced changes in spH fluorescence are abolished with the removal of extracellular calcium, but return when it is replaced. Black bars in C–E indicate the duration of stimulus trains. F, EPP trains were recorded from Tg SpH muscle fibers during tetanic nerve stimulation (50 Hz, 15 s) and the average quantal content of each EPP in the train was calculated (n = 5 mice, 22 cells). The cumulative number of quanta released is plotted as a function of time (smooth gray line; left axis). Error bars are shown at every 50th EPP beginning at 0.5 s (gray error bars). Mean spH fluorescence changes obtained once every second during an identical 50 Hz, 15 s stimulus train are also plotted (black squares; right axis; n = 6 animals, 12 cells). The nearly complete superimposition of the two curves emphasizes the reliability of spH as an indicator of synaptic activity.
Figure 3.
Figure 3.
SpH and endogenous synaptic vesicle proteins are colocalized and heterogeneously distributed within synaptic terminals. A, Confocal images of a spH (green) expressing junction fixed and immunostained for the synaptic vesicle protein SV2 (grayscale; blue in overlay), and labeled with Al594-αbtx (AChRs, red). Scale bar, 25 μm. B, Linescan graph of AChR, SpH, and SV2 fluorescence intensities measured over a branch of the junction (white dashed line in A). The patterns of SpH and SV2 intensities are similar with respect to each other, but vary with respect to that of AChRs. C–E, Scatterplots comparing SV2 versus SpH (C), AChR versus SpH (D), and AChR versus SV2 (E) fluorescence from multiple immunostained junctions. Each point represents the average fluorescence intensities within a small manually selected ROI. SV2 and SpH fluorescence are highly correlated (linear correlation coefficient, r = 0.90), but AChR and SpH or SV2 fluorescence are not (r = 0.31 and 0.32, respectively).
Figure 4.
Figure 4.
The rate and extent of neurotransmitter release varies within active motor terminals. A, SpH expressing neuromuscular junction with pseudocolored panels illustrating fluorescence intensities at several time points before and after nerve stimulation. A 15 s, 50 Hz stimulus was delivered 10 s after imaging began (note increase in intensity between 10 and 25 s panels). The first and last panels in the series (0 and 90 s, respectively) were left in their original grayscale formats to illustrate observed SpH fluorescence levels. AChRs were visualized with Al594-αbtx. Scale bar, 5 μm. B, Mean fluorescence intensity measurements of several terminal ROIs (colored circles in the 0 s frame) plotted over time reveal heterogeneity in the extent of exocytosis within the junction. In this example, there was a four-fold range in intensity changes (ΔF) among these regions. Prestimulus fluorescence was set to zero for each ROI. Black bar indicates duration of stimulus train. C, Scatterplot comparing the maximum stimulus-induced fluorescence changes (ΔFstim) within each ROI with fluorescence changes induced by 50 mm NH4Cl application (ΔFNH4Cl). There is a strong linear correlation between the data (r = 0.94), suggesting a close, direct relationship between the relative abundance of synaptic vesicles within a terminal region (ΔFNH4Cl measurements) and the number released with stimulation (ΔFstim measurements).
Figure 5.
Figure 5.
The rate and extent of neurotransmitter release varies within active motor terminals. A, Pseudocolored image of a junction illustrating SpH fluorescence changes induced by nerve stimulation (ΔFstim; 50 Hz, 15 s). Scale bar, 15 μm. B, Pseudocolored image of the same junction illustrating fluorescence changes induced by application of 50 mm NH4Cl (ΔFNH4Cl). Note difference in intensity scales between the two images. C, Pixel-by-pixel intensity correlation plot of images in A and B. The images were aligned and the fluorescence intensities of each pixel location within the junction were compared. The black trendline was generated using least squares fit method. There is a relatively high degree of correlation (r = 0.75) between the images in that brighter pixels in one image were likely to be brighter in the other. D, Fluorescence ratio image obtained by dividing ΔFstim in A by ΔFNH4Cl in B and multiplying by a factor of 100. Pixel intensities provide a relative measure of the fraction of the total spH+ vesicle pool released with stimulation. Asterisks mark several examples of fluorescence hotspots. E, Pixel intensity histogram of image in D. Fluorescence intensities (x-axis) are normally distributed with a mean value of 34.7 ± 3.2. F, Averaged intensity histogram of several junctions analyzed as in D (n = 16 junctions). Each junction showed a normal intensity distribution with most having a peak between 25 and 35. Mean pixel intensity is 31.8 ± 2.6. Together, these results suggest, as in Figure 4, that a relatively constant fraction of the total vesicle pool at a given site is released with nerve stimulation.
Figure 6.
Figure 6.
Neurotransmitter release is related to vesicle pool size at a given site regardless of stimulus intensity. A–E, Maximum activity-induced fluorescence changes (ΔFstim) within a junction stimulated at 10, 20, 30, 40, and 50 Hz. Each stimulus train was 15 s. Scale bar, 15 μm. Arrowheads mark several representative areas that consistently show greater vesicle release relative to other regions within the terminal. A'–E', Intensity changes induced by 50 mm NH4Cl (ΔFNH4Cl), applied before each train. The muscle was bathed in normal Ringer's solution for at least 5 min before nerve stimulation and allowed to rest for at least 5 min after to ensure complete recovery of resting fluorescence levels. A“–E”, Fluorescence ratio images for each stimulus frequency obtained by dividing ΔFstim images by ΔFNH4Cl images (as in Fig. 5D). F–J, Pixel intensity correlation plots of ΔFstim versus ΔFNH4Cl for each stimulus frequency. Black line represents best linear fit. The trendline slope increases with frequency, as does the correlation coefficient. F, 10 Hz, slope = 0.10; r = 0.60. G, 20 Hz, slope = 0.17; r = 0.66. H, 30 Hz, slope = 0.25; r = 0.71. I, 40 Hz, slope = 0.29; r = 0.77. J, 50 Hz, slope = 0.33; r = 0.78. K, Cumulative pixel intensity histograms of ΔFstimFNH4Cl ratio images from A“–E”. As expected, the histograms shift steadily toward larger intensity values with increasing frequencies up to 30–40 Hz (compare with Fig. 2C). In addition, the slopes of the linear portion of the curves are less steep at higher frequencies, indicating a relatively wider distribution of pixel intensities. L, Colored traces show average ΔFstimFNH4Cl values for seven hotspots (colored asterisks in A“–E”) within the junction shown. Color of each trace corresponds to asterisk color. Black trace depicts the average ΔFstimFNH4Cl value for the entire junction at each stimulus frequency. Although there is some variability between trials, the average pixel intensity values of each hotspot region are consistently greater than the mean for the junction.
Figure 7.
Figure 7.
Spatial patterns of vesicle release sites remain relatively constant over time. A–C, Pseudocolor images of the same junction shown in Figure 6 illustrating fluorescence increases during a 50 Hz stimulus train at 5, 10, and 15 s. Locations of greater release (several representative examples indicated by arrowheads) remain fairly stable over the duration of the stimulus. A'–C', ΔFstimFNH4Cl ratio images at each time point. Scale bar, 15 μm. The spatial distribution of hotspots (asterisks) also remains constant between time points, although their sizes and intensities tend to become larger. D–F, Pixel intensity histograms of ΔFstimFNH4Cl images in A'–C', respectively. The histograms shift to the right over the duration of the stimulus, as expected. Average ΔFstimFNH4Cl values = 17.3 (5 s), 23.2 (10 s), 29.2 (15 s). Additionally, the distribution of pixel intensities increases (note the increasing width of histograms), indicating larger and brighter hotspots as compared with earlier time points. G, Colored traces show average ΔFstimFNH4Cl values for eight hotspots (colored asterisks in A'–C') after 5, 10, and 15 s of stimulation at 50 Hz. Color of each trace corresponds to asterisk color. Black trace depicts the average ΔFstimFNH4Cl value for the entire junction at each time point. The average intensity of each hotspot region is greater than the mean for the junction at all time points.
Figure 8.
Figure 8.
Heterogeneity of vesicle release correlates with synaptic vesicle distribution as revealed by immunostaining. A, Images illustrating stimulus-induced terminal fluorescence changes (50 Hz, 15 s; ΔFstim). B, Fifty micromolar NH4Cl-induced fluorescence changes (ΔFNH4Cl) within the same junction. C, Confocal image of SV2 immunostaining after muscle fixation. Pseudocolor images correspond to boxed areas in grayscale panels above. Scale bars, 15 μm. D, Scatterplot comparing ΔFstim and SV2 staining intensities for multiple ROIs within the junction pictured. There is a high degree of linear correlation between the areas measured (black trendline; r = 0.88). E, Histogram of ΔFstim versus SV2 correlation coefficients (r values) for 16 junctions analyzed as above reveals a relatively close relationship between the number of vesicles released and the total vesicle pool size within a terminal.

Similar articles

Cited by

References

    1. Balice-Gordon RJ, Lichtman JW. In vivo observations of pre- and postsynaptic changes during the transition from multiple to single innervation at developing neuromuscular junctions. J Neurosci. 1993;13:834–855. - PMC - PubMed
    1. Bennett MR, Lavidis NA. The probability of quantal secretion at release sites in different calcium concentrations in toad (Bufo marinus) muscle. J Physiol (Lond) 1989;418:219–233. - PMC - PubMed
    1. Betz WJ, Bewick GS. Optical analysis of synaptic vesicle recycling at the frog neuromuscular junction. Science. 1992;255:200–203. - PubMed
    1. Caroni P. Overexpression of growth-associated proteins in the neurons of adult transgenic mice. J Neurosci Methods. 1997;71:3–9. - PubMed
    1. Delgado R, Maureira C, Oliva C, Kidokoro Y, Labarca P. Size of vesicle pools, rates of mobilization, and recycling at neuromuscular synapses of a Drosophila mutant, shibire. Neuron. 2000;28:941–953. - PubMed

Publication types

MeSH terms

LinkOut - more resources